
This week, financial markets will digest a series of key reports on the health of the United States’ economy in the second quarter, with reports due out on:
- Business capital spending: Durable goods orders and shipments for April, the Richmond and Dallas Federal Reserve (Fed) Manufacturing Indices for May, and the Chicago Area Purchasing Managers’ Index for May.
- Housing: Pending home sales for April and the S&P/Case-Shiller Home Price Index for March; and
- Consumer spending: May consumer confidence measures from the Conference Board and the University of Michigan and personal income and spending for April.
The data released thus far for April and May all suggest that real gross domestic product (GDP) growth will accelerate to between 4% and 5% in the second quarter of 2014, after a weather-induced slowdown in growth in the first quarter of 2014. The data include:
- Employment;
- Vehicle sales;
- Initial claims for unemployment insurance;
- Institute for Supply Management (ISM) Indices;
- Philadelphia and New York Fed Manufacturing Indices;
- Retail sales; and
- New and existing home sales.
Investors will get a look at the revised figures for first quarter GDP this week as well. The data released for February and March 2014 since the first quarter GDP data were first reported in late April 2014 suggest that, upon revision, first quarter GDP could turn negative. As we noted in last week’s Weekly Economic Commentary: Snapback, we do not think the economic weakness in the first quarter is the start of another recession, and, indeed, we continue to expect real GDP will expand 3.0% in all of 2014.*
Why So Slow?
The pace of business capital spending in this cycle has been unusually slow. Uncertainty around the durability of the expansion itself, lack of clarity on fiscal and in some cases monetary policy, and the unwillingness by businesses to spend cash due to fears that the next downturn will be just like the last one are among the contributing factors. In addition, corporate managements have seen stock prices respond better to using corporate cash for share buybacks and dividend increases.
We continue to see conditions that, in the past, have been conducive to a solid pace of capital spending. Low interest rates for corporate borrowers, shrinking spare capacity, aging industrial equipment, the ongoing secular trend to replace labor with capital, the energy renaissance and related spending, a steady stream of Good Old American Know-How, and faster economic growth here and abroad could generate more capital spending in the coming quarters and years.
The Details
Business capital spending -- business spending on equipment like computers, medical equipment, vehicles, copiers, furniture, construction and mining equipment, and on intellectual property, research and development (R&D), entertainment, literary and artistic patents, and other items -- decreased between the fourth quarter of 2013 and the first quarter of 2014, and the revised data (due out later this week along with the revised first quarter 2014 GDP data) will likely show an even bigger decline. It was just the second time since the start of the current economic expansion, which began in mid-2009, that business capital spending contracted in a quarter.
As noted in Figure 1, the overall pace of inflation-adjusted (or real) GDP growth in this expansion has been below average. Real GDP has grown by just 11% since the end of the last recession. The average increase at our current point into a recovery has been 19%. Although it is true that the slow pace of consumption, housing, and, in particular, government spending are the main culprits behind the sluggish rebound in the economy since mid-2009, none of the main sectors of GDP have kept pace with gains seen during the last three economic recoveries -- those that began in 1982, 1991, and 2001. The U.S. economy has changed significantly since the end of the inflationary 1970s. The last 30-plus years have seen the transformation of the U.S. economy from a domestically focused manufacturing economy to a more export-heavy, service-based economy. In general, this economic structure is less prone to inventory swings that drove the shorter boom-bust cycles of the past, and has led to longer expansions. We use these three cycles as comparisons in most of our analysis in this commentary.
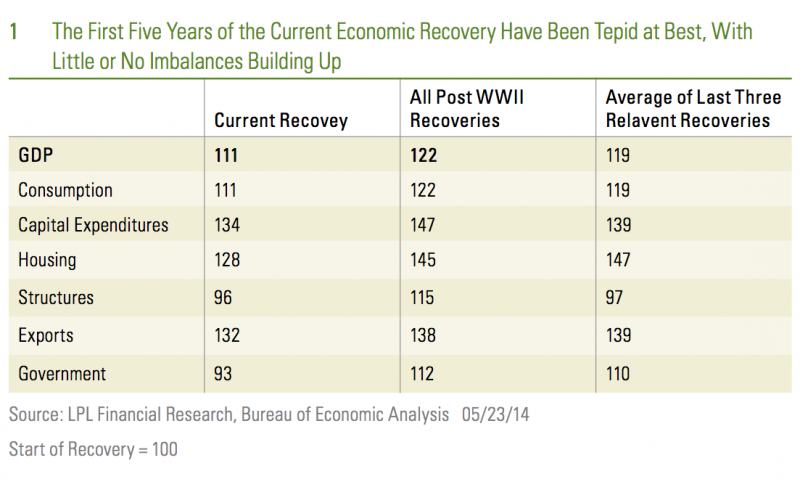
For example, business capital spending has increased by just 34% since the end of the Great Recession, below the average gain of 39% through the first 19 quarters of the prior three cycles -- those commencing in 1982, 1991, and 2012. Business spending on structures (office buildings, malls, shopping centers, etc.) has almost kept up with the average of the past three cycles, seeing a 4% drop over the past five years versus the average of a 3% drop, as have exports, which have risen by 32% versus the average gain of 39%.
On balance, the sluggish nature of the recovery thus far -- as well as the fact that none of the major economic sectors have grown faster than average -- strongly suggests that the tepid pace of the expansion thus far has not allowed imbalances to build up in the economy. These imbalances (overbuilding, overinvesting, or overspending) are typically what brings premature ends to economic recoveries. Our view remains that the odds of recession in the next several years are low (between 10% and 15%) and that we are somewhere in the “middle innings” of the recovery that will turn five this summer.
Capital Spending Trends in the Current Recovery
A closer look at the capital spending trends during the economic recovery [Figure 2] reveals that business spending on “traditional” capital spending areas like industrial equipment, and especially transportation equipment -- business purchases of autos, trucks, railcars, shipping containers, aircraft, ships, and boats -- have soared during the recovery. In fact, each of these key subcomponents of transportation equipment has seen well above-average gains in this business cycle relative to the prior three cycles. This reflects the impact of the energy renaissance and, in part, the snapback in U.S. manufacturing jobs as companies reconsider the offshoring and outsourcing that dominated the economy since the early 1980s. The surge in transportation capital spending also reflects the near collapse of the U.S. auto industry in late 2008/early 2009.
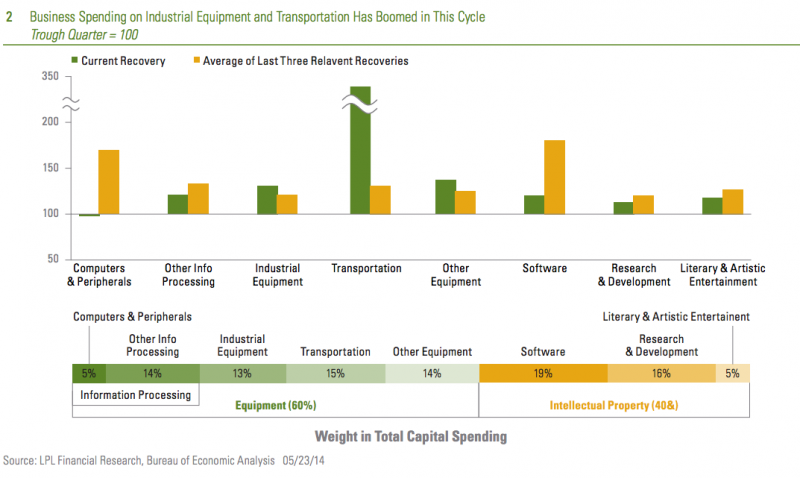
Similarly, business spending on industrial equipment (which accounts for 13% of overall business capital spending and includes items like construction machinery and mining equipment) has surged during this recovery, partially reflecting the ongoing energy renaissance and the solid performance of both commercial construction and residential construction -- since late 2011 -- in this cycle.
Remarkably, business capital spending on information processing equipment -- the bellwether for business capital spending in the 1990s and 2000s -- has lagged far behind the spending seen in previous cycles. Spending on computers and peripheral equipment has increased by just 10% since the end of the recession, the slowest pace of advance in this category in any recovery in the past 55 years. One area within this broad category that has bucked the trend is photocopy and related equipment, where spending is up 60% since the end of the recession, far exceeding the gains seen at this point in any recovery in the past 55 years.
Corporate spending in the intellectual property categories of capital spending in this cycle has also lagged behind the pace seen in prior cycles, and this is concerning given the U.S. reliance on “Good Old American Know-How” (see the 8/19/13 Weekly Economic Commentary: Exporting Good Old American Know-How) for exports and jobs. The longer-term health and competiveness would benefit greatly from resurgence in this area of capital spending in the period ahead.
On balance, the pace of business capital spending -- along with most other categories of GDP -- has fallen short of the pace seen in prior recoveries. This suggests that the overspending, overbuilding, or overinvesting in one or more sectors that ultimately lead to imbalances in the economy and, inevitably, recessions, are not present today. Rather, the conditions are in place for a pickup in business spending in the latter half of the business cycle, and we continue to expect the pace of business capital spending to accelerate over the next several years. A pickup in business capital spending over the next several years is vital for the long-term health and viability of the U.S. economy in the years and decades to come.
IMPORTANT DISCLOSURES
The opinions voiced in this material are for general information only and are not intended to provide specific advice or recommendations for any individual. To determine which investment(s) may be appropriate for you, consult your financial advisor prior to investing. All performance reference is historical and is no guarantee of future results. All indices are unmanaged and cannot be invested into directly.
The economic forecasts set forth in the presentation may not develop as predicted and there can be no guarantee that strategies promoted will be successful.
Gross domestic product (GDP) is the monetary value of all the finished goods and services produced within a country’s borders in a specific time period, though GDP is usually calculated on an annual basis. It includes all of private and public consumption, government outlays, investments and exports less imports that occur within a defined territory.
The Chicago Area Purchasing Manager Index that is read on a monthly basis to gauge how manufacturing activity is performing. This index is a true snapshot of how manufacturing and corresponding businesses are performing for a given month. A reading of 50 or above is considered a positive reading. Anything below 50 is considered to indicate a decline in activity. Readings of the index have the ability to shift the day's trading session one way or another based on the results.
The S&P/Case-Shiller U.S. National Home Price Index measures the change in value of the U.S. residential housing market. The S&P/Case-Shiller U.S. National Home Price Index tracks the growth in value of real estate by following the purchase price and resale value of homes that have undergone a minimum of two arm's-length transactions. The index is named for its creators, Karl Case and Robert Shiller.
This research material has been prepared by LPL Financial.
To the extent you are receiving investment advice from a separately registered independent investment advisor, please note that LPL Financial is not an affiliate of and makes no representation with respect to such entity.
Not FDIC or NCUA/NCUSIF Insured | No Bank or Credit Union Guarantee | May Lose Value | Not Guaranteed by any Government Agency | Not a Bank/Credit Union Deposit
John Canally is an economist and investment strategist for LPL Financial


