
By Barry Ritholtz
Bloomberg View) --Oh no, the VIX broke 10 this week -- a brutal stock-market crash and decade-long bear market is all but upon us.
Which leads me to the latest episode in our series of market-indicator debunkings, prompted by the following question: Is the VIX really the market’s fear indicator?
Your immediate reaction is probably “Of course the VIX is the fear indicator.” You know this because you have A) looked closely at the underlying data, B) tracked the correlation between VIX trading and stock prices, C) considered what the VXX futures trading has done to VIX volume and pricing, and D) have thought long and hard about it.
Or maybe not so much.
What I suspect is more likely is that many people making this claim are just repeating what they have heard on trading desks since, well, forever. That sort of meme propagation is popular for the folks who start with their conclusion and work backward, looking for supporting evidence. It is a bad form of analysis and a worse process for investing.
Instead, let’s consider some of the underlying factors impacting the VIX -- or more correctly, the Chicago Board Options Exchange Volatility Index, which reflect market estimates of future volatility -- to see if we can properly frame what it means for investors and traders.
Vexing VIX:
No. 1. VIX Under 10: Let’s begin with the issue that made the rounds this past week: The VIX broke 10, and the past time it did that was 2007 and you know what happened next.
There are two obvious problems with this line of thinking. The first is the tiny sample set of how often the VIX is in single digits. We had the mid-2000s, and the early 1990s and now. There are simply not a whole lot of recent examples when the VIX was that low. The second is the overemphasis on 2007. The financial crisis and stock collapse wasn’t about stock-market complacency and a low VIX.
See the chart below:
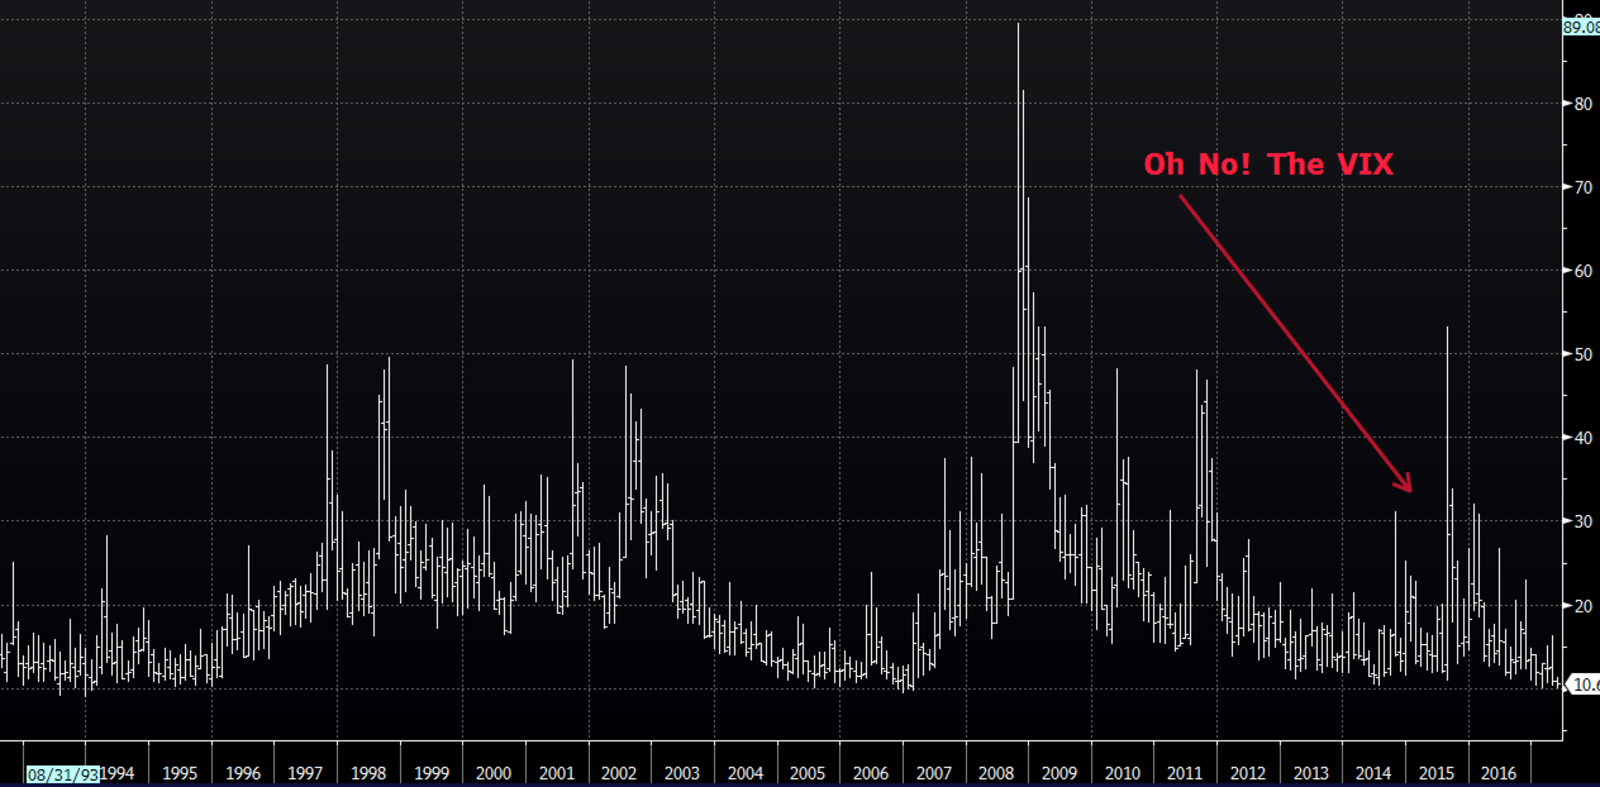
This is what happens when markets trend lower for a while. In all three examples when the VIX went below 10, markets were more than five years into recoveries from major plunges: The 1987 crash, the dot-com implosion in 2000 and the financial crisis in 2008-09. In each of these cases, markets afterward rose double-digit rates for a good long while as the VIX fell.
Yes, I recall how the 1990s ended, with the Standard & Poor’s 500 Index down 47 percent and the tech-heavy Nasdaq Composite Index shellacked by almost 80 percent. But that raises a separate question: Are you willing to give up six years of those sorts of gains to avoid the possibility -- not the certainty -- of a market crash at the end? And what makes you believe you have the intestinal fortitude to be able to jump back if there is a major retreat?
No. 2. VIX is a bet on prescience and probability: When we break it down to its most basic components, the VIX is in part a reflection of what option traders believe the markets might do during the next 30 days. The market sets prices in response to demand, which is driven by all sorts of things: Sentiment, news, and of course, investor angst.
How informative is this? Insurance on the possibility of your house burning down to the ground is not the same as a forecast your house will burn to the ground. Similarly (and the so-called wisdom of the crowd notwithstanding) we don’t often see packs of traders being especially accurate when acting on their trepidations.
No. 3. VIX is a mirror image of market trend: The VIX often drifts inversely to the dominant trend. In a rising market, the VIX slips lower; when we see minor pullbacks, it blips higher; when we see significant moves down, it jumps up wildly.
However, none of these signals are especially timely. We have yet to see any evidence that this is remotely informative in advance. Note that the VIX surges when markets are getting whacked, but it isn’t a reliable leading indicator. There are numerous false positives of rising VIX on a modest pullback.
No. 4. It isn’t just equities: Bank of America Merrill Lynch has a Move Index that looks at expected volatility in the U.S. Treasury market. It too has been falling, despite the Federal Reserve’s rate increases and indications of more to come. The Financial Times earlier this week wrote that “If you look at implied volatility, it is at or near one-year lows across every asset class and nearly every region.” This suggests to me that something else may be at work besides investor complacency.
No. 5. Are investors still hedging?: My colleague Josh Brown credits the rise of indexing and rediscovery of buy-and-hold investing with the reduction in the desire to hedge equity exposure. I agree with his analysis. Investors may simply be “relying less on S&P 500 index options for protective insurance on their portfolios,” as the Wall Street Journal noted.
No. 6. Technical reasons: Bloomberg Markets observed that VIX exchange-traded products linked to the index “have altered the futures market, and at times indirectly influenced the index itself.” We have to recognize the possibility that the new instruments have changed how the old instruments trade.
The bottom line is simply that the VIX tells us very little about what the market is likely to be doing tomorrow, or next month, or even next year. It certainly is not the reliable prophesy of doom some perma-bears make it out to be.
This column does not necessarily reflect the opinion of the editorial board or Bloomberg LP and its owners.
Barry Ritholtz is a Bloomberg View columnist. He founded Ritholtz Wealth Management and was chief executive and director of equity research at FusionIQ, a quantitative research firm.
He blogs at the Big Picture and is the author of “Bailout Nation: How Greed and Easy Money Corrupted Wall Street and Shook the World Economy.”
To contact the author of this story: Barry Ritholtz at [email protected] To contact the editor responsible for this story: James Greiff at [email protected]
For more columns from Bloomberg View, visit bloomberg.com/view


