(Bloomberg) -- As goes January, so goes the year.
That’s the theory of a phenomenon known as the “January Barometer,” which suggests that if the stock market rises during the first month of the year, further gains may be in store for the next 11 months. Since 1950, the so-called January Barometer has been right 84.5% of the time, according to the Stock Trader’s Almanac.
The S&P 500 surged 27% in 2021, surpassing most bullish outlooks. But analysts expect returns to be more modest this year as the Federal Reserve winds down its massive stimulus support to combat rising inflation. This is expected to weigh on corporate earnings growth, and eventually stock prices.
“While the Fed has promised patience and a slow pace, it is now rather clear that they will be making a concerted effort to remove quantitative easing by mid-year and begin slowly raising rates,” Jeffrey Hirsch, editor of the Stock Trader’s Almanac, said in a note. “Plus it promises to be a contentious midterm election year and the battle against Covid-19 may linger.”
In spite of omicron’s rapid spread and travel disruptions, the S&P briefly eclipsed its all-time closing high in morning trading in New York, climbing as much as 0.6% before paring gains to trade 0.3% higher. The tech-heavy Nasdaq 100 advanced 0.6%.
To solidify his market outlook in 2022, Hirsch is looking to another stalwart of the almanac: The “January Trifecta,” which is based on the so-called Santa Claus rally, the market’s direction in the first five trading days of the new year and the January Barometer. All three indicators have solid track records of predicting the market’s direction for the remainder of the year.
When all three were up, the S&P 500 has risen 90% of the time with an average gain of 17.5%, Hirsch’s data show. When any of the indicators were down, the year’s results were reduced. And when all three were down, the S&P 500 fell three out of eight years, with an average loss of 3.6%.
In midterm election years, however, the stock market’s performance in the first five trading days of a new year isn’t as good at projecting future gains. Market returns tend to be muted until later in the year, as there is less certainty of the outcome and the subsequent effects on policy changes. Midterms, which occur halfway between presidential elections, will take place Nov. 8. They decide which political party — Democratic or Republican — will hold a majority in each chamber of Congress for the next two years.
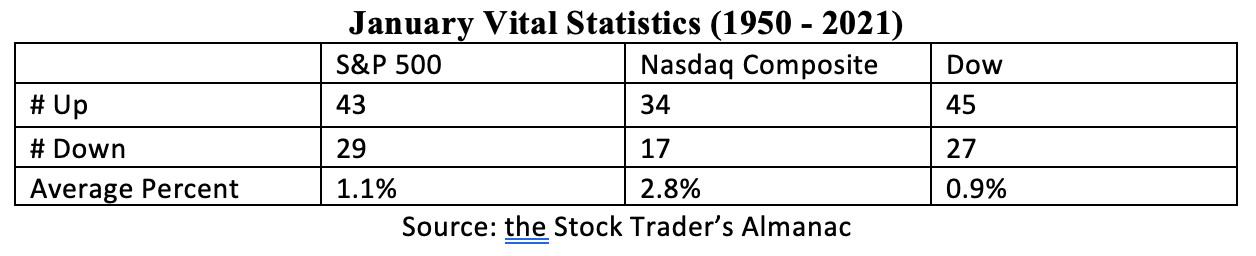
It’s less clear what the January Trifecta could mean for the future performance of technology and energy stocks, which were both among the top-performing S&P 500 sectors in 2021 with gains of over 30%. Since 1950, technology and small-cap shares in January fared slightly better than the broader large-cap space during midterm election years, with the S&P 500 averaging a decline of 0.7% while the Russell 2000 fell 0.6%. The Nasdaq Composite was barely positive, rising less than 0.1%, according to the Stock Trader’s Almanac.