
The year 2022 was particularly difficult for many investors because it was the first time that both the S&P 500 Index, which lost 18.1%, and long-term Treasury bonds (20-year maturity), which lost 26.1%, experienced double-digit declines. In fact, it was only the third year ever (2009 and 2013 are the other two) that long-term Treasury securities produced double-digit losses.
The fact that both stocks and safe bonds produced large losses was a big surprise to investors who, influenced by recency bias, came to believe that safe bonds were a sure hedge against risky stocks. The data over the period January 2000-November 2022 provided the rationale—the monthly correlation between the two was -0.2. That led investors to believe in what came to be referred to as the “Fed put”—if stocks fell sharply, the Fed would rescue them by lowering interest rates.
Unfortunately for investors who do not know their history, correlations are not constant; they are time varying/economic regime dependent. For example, over the period 1926-1999, the correlation was in fact positive, at 0.18. Positive correlation means that when one asset tends to produce better-than-average returns, the other also tends to do so. And when it produces worse-than-average returns, the other tends to do so at the same time. With stocks and bonds, time-varying correlation is logical. For example, if we are in an economic regime when inflation is rising from very low levels (e.g., when coming out of a deflationary recession), stocks will tend to do well as economic activity picks up, boosting demand, while bonds will tend to perform poorly as rates rise. However, when inflation increases at levels that begin to concern investors (as it did in 2022), stocks can perform poorly at the same time bonds do. That was also the case in 1969, when the Consumer Price Index rose above 6% and the S&P 500 lost 8.5% and long-term Treasury bonds lost 5.1%.
New Research
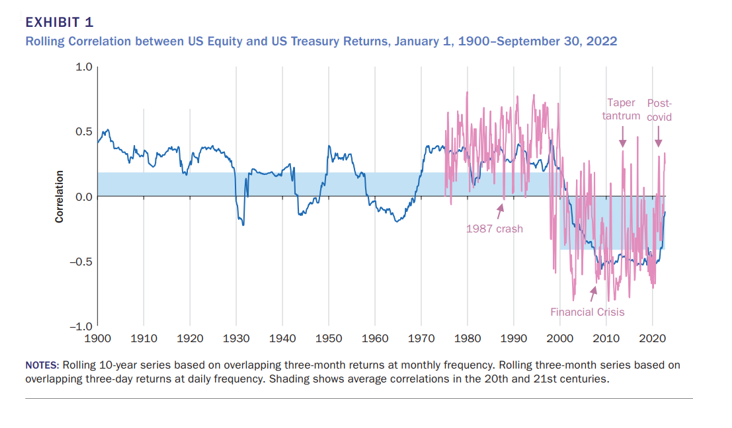
AQR’s Alfie Brixton, Jordan Brooks, Peter Hecht, Antti Ilmanen, Thomas Maloney and Nicholas McQuinn open their recent study, Changing Stock–Bond Correlation: Drivers and Implications, in which they analyze the implications for investors of a change in the correlation relationship between stocks and bonds and seek to identify the catalysts for shifting correlations, by presenting the following chart, which demonstrates the regime shifting nature of the correlation discussed above:
The next chart shows the expected volatility of a traditional 60/40 stock-bond portfolio at different levels of assumed correlation between the two asset classes. The authors found that if the Stock/Bond Correlation (SBC) rose from -0.5 to +0.5, 60/40 portfolio volatility increased by around 20%. In addition, two measures of downside risk—12-month value at risk (VaR) and largest drawdown (based on simulated data) both increased by about 30% from left to right (as the correlation rises, portfolio volatility increases, increasing portfolio risk and the maximum drawdown).
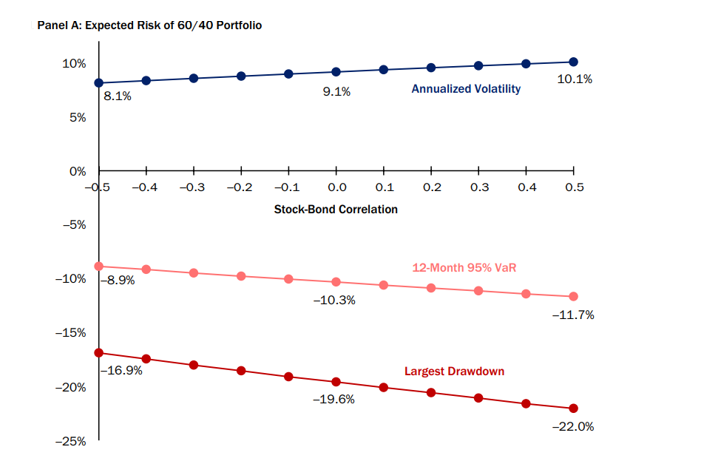
Such significant increases in risk could require meaningful allocation changes, because if risk tolerance stayed the same, investors would need to decrease their equity allocation to maintain constant portfolio risk, resulting in a reduction in returns to the portfolio.
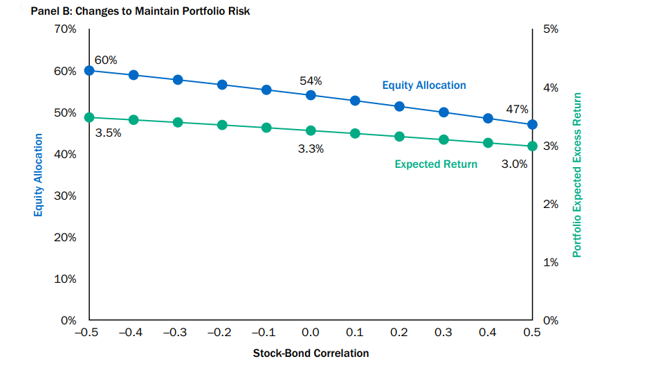
The next chart shows a reduction from 3.5% excess portfolio return at -0.5 to 3.0% excess return at +0.5. The authors explain: “In other words, asset class diversification is not just about risk—it’s about returns, too.”
AQR’s researchers also noted that there may be another indirect consequence of a higher SBC: “Economic reasoning would suggest bonds’ negative equity beta since 2000 contributed to their high valuation, as investors were willing to hold bonds at a lower expected return given their valuable diversification. Of course, realized returns were high, not low, during this period. But this need not be at odds with lower expected returns as investors may have expected mean reversion in yields (and policy rates) that never manifested. If this is true, the reemergence of a positive SBC, by making bonds less-valuable diversifiers, would probably also raise their yields. This would make the transition even more painful for stock–bond investors, but in the long term, it may increase bonds’ expected returns.”
Drivers of SBC Correlation
To determine what drives variation in the SBC, AQR’s team examined the fundamental macroeconomic drivers of stock and bond returns: growth and inflation. They noted that while positive growth news is good for equities, it raises expectations for short-term interest rates, through both the systematic response of central banks and through its influence on the equilibrium real interest rate (or “r-star”), so bond prices fall. The result is that stocks and bonds generally have opposite-signed sensitivities to growth news. However, when inflation increases at levels that begin to concern investors, stocks can perform poorly at the same time bonds do. Thus, stocks and bonds, nonetheless, can have same-signed sensitivities to certain inflation news.
The following chart shows the difference in Sharpe ratio for stocks and bonds in each regime compared with its full-period average. The data shows that equities strongly prefer “growth up” environments, while bonds exhibit the opposite relationship. With regard to inflation, both asset classes prefer “inflation down,” although bonds’ sensitivity is noticeably stronger.
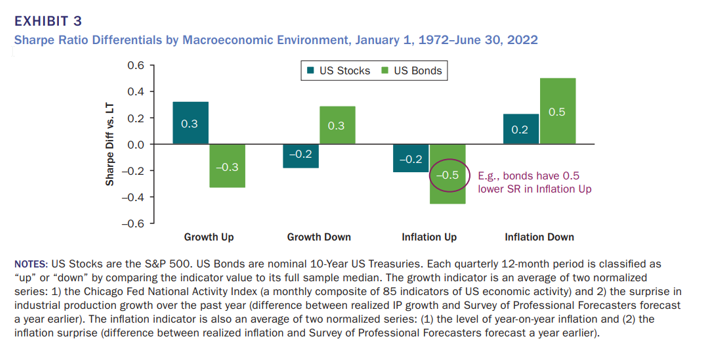
These findings led the authors to conclude: “We find that stocks and bonds have opposite sensitivities to economic growth but directionally similar sensitivities to inflation. In other words, growth shocks drive stock and bond returns in opposite directions, while inflation shocks drive them in the same direction.” Based on historical data, they found that during periods when growth uncertainty was dominant, as in the last two decades, the SBC was likely to be negative because bonds are viewed as a hedge against negative growth shocks. We should also keep in mind that stocks have a stronger sensitivity to growth shocks, and bonds have a stronger sensitivity to inflation shocks. Ultimately, the authors note, “What matters is the magnitude of inflation news relative to growth news, not the direction of that news.”
A Simple Model to Understand the SBC
The AQR team then used this established relationship to create a simple model linking unexpected returns to inflation and growth news.
Their model’s inputs were the U.S. year-over-year industrial production and Consumer Price Index rolling 10-year volatility as measures of growth and inflation uncertainty (see Panel A below). Their third explanatory factor was the correlation between growth and inflation, proxied with the rolling 10-year correlation between 12-month changes in industrial production and 12-month percentage changes in CPI (see Panel B below). Their data sample covered the period December 1936-September 2022.
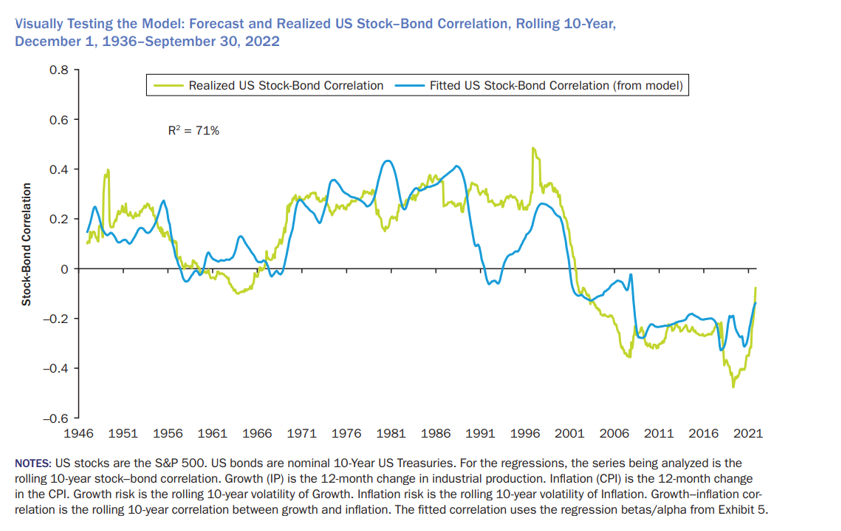
The following chart shows that the model provides a good fit for the forecast SBC relative to the realized SBC, with an r-squared of 71%.
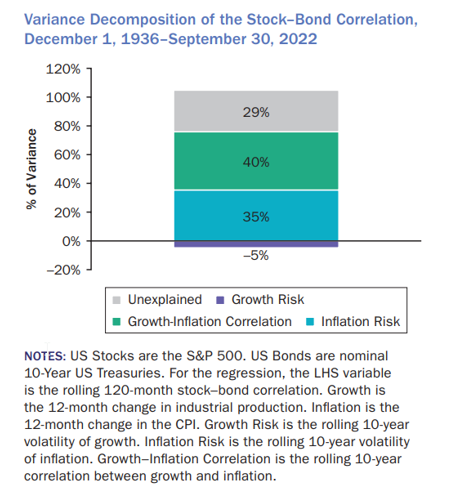
The following table, which decomposes the variance of the SBC into its three drivers (as well as the portion that is unexplained by the model), demonstrates that inflation risk explains much more of the variation than growth risk, with the growth-inflation correlation also very important.
The authors also observed that the secular downward trend in real rates, which led to a rise in both stock and bond valuations, was not a driver of the SBC—it remained negative even as both asset classes experienced this tailwind. “It follows that a reversal in the trend—a return to rising yields and cheapening of both asset classes—would not necessarily produce a positive SBC, unless it were accompanied by (or a response to) a sustained rise in inflation uncertainty.”
Explaining the Shifting SBC Regimes
Attempting to explain the shift to a negative SBC regime experienced in most recent decades, the authors offered this hypothesis—it was result of:
1. Good luck. “In the 25 years preceding the 2020s, demand shocks have been much more variable than supply shocks. Demand shocks contribute to a negative SBC by driving growth and inflation in the same direction (indeed, that is the definition of a demand shock), contributing to a positive growth–inflation correlation. The prevalence of demand shocks relative to supply shocks is likely also a contributor to inflation volatility being so subdued.”; and
2. Good Policy. “Central bankers since Volcker have emphasized low and stable inflation as a necessary backdrop for strong growth. Their resolute determination to hit their inflation objectives and their good communication have strongly anchored longer-term inflation expectations, resulting in very moderate levels of inflation uncertainty.” They concluded that the outcome was likely some of both—good luck and good policy.
Investor Takeaways
The most important takeaway is that investors should not count on a return to the negative SBC relationship experienced over the 25 years prior to 2022. A shift toward a more positive SBC would result in an increase in portfolio risk, with implications for asset allocation for risk-averse investors. If central banks are successful at curbing inflation (by putting the brakes on the economy) and maintain their inflation-fighting credibility, we could see a return to the negative SBC that characterized recent decades. If, however, they are unsuccessful and supply shocks are more prevalent moving forward or central banks lose their inflation-fighting credibility (perhaps due to a lack of resolve in bringing inflation down to target when economic conditions deteriorate), we could see a return to more historically normal levels of positive SBC. Unfortunately, all crystal balls are cloudy. Investors should understand that a rise in longer-term inflation uncertainty accompanied by further supply-driven inflation shocks and/or monetary policy errors would likely lead to a sustained shift to a positive SBC regime, which would lead to increased tail risk for investors.
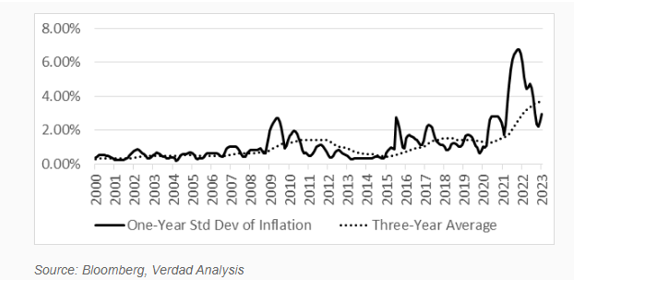
The historical evidence shows that inflation volatility and growth volatility tend to persist period over period. Thanks to the research team at Verdad, the chart below demonstrates that inflation uncertainty has been rising, and it is the level of uncertainty that is the driver of the SBC.
Given that both the drivers of uncertainty levels and correlations tend to persist, Verdad concludes: “At least in the short term, we believe higher stock-bond correlations are likely to persist, for the simple reason that stock-bond correlations tend to exhibit some level of autocorrelation. Last month’s correlation between stocks and bonds is predictive of next month’s correlation, with next month's correlation typically having the same sign as the previous month.”
Of further concern is that the inflation outlook remains uncertain, as there is always the risk that the Fed has gotten “behind the curve” and inflation will remain “sticky.” That could cause the Fed to remain tighter for longer, which would be a negative surprise to the markets. It would also be negative for stocks, as they prefer a growth regime, and bad for bonds as well because bonds prefer a regime of falling inflation.
One way to address the risk of increased stock and bond correlation may be to add alternative assets to a portfolio. And, given that the inflation shock risk is the largest risk to the SBC, assets that tend to do well in rising inflation periods, or at least are not negatively impacted, should be considered. One such asset is commodities, which have been lowly correlated to both stocks and bonds on average and have delivered stronger diversification during periods of inflation uncertainty. For example, over the period December 2010-January 2023, Dimensional’s Commodity Strategy Fund (DCMSX) had monthly correlation to Vanguard’s S&P 500 Index ETF (VOO) of 0.49, and its monthly correlation to Vanguard’s Intermediate-Term Treasury Fund (VFITX) was -0.18. Others with low to no correlation to stocks and bonds include:
Long-short multi-asset alternative risk premia strategies (such as used by AQR’s Style Premia Alternative Fund, QSPRX, which invests long and short across five different asset groups—stocks and industries, equity indices, fixed income, currencies and commodities—and four investment styles—value, momentum, carry and defensive—and aims to be market neutral). Thanks to the correlation tool at Portfolio Visualizer, we can see that from October 2014 through January 2023, the monthly correlation of QSPRX to Vanguard’s S&P 500 Index ETF (VOO) was 0.01, and its monthly correlation to Vanguard’s Intermediate-Term Treasury Fund (VFITX) was -0.15;
Trend-following strategies (such as AQR’s Managed Futures Fund, AQMIX, which trades over 100 liquid contracts across four major asset classes). From October 2014 through January 2023, the monthly correlation of AQMIX to VOO was -0.22 and its monthly correlation to VFITX was -0.09;
Senior, secured, sponsored floating rate credit (such as provided by Cliffwater’s Corporate Lending Fund, CCLFX, the largest interval fund in the asset class). From July 2019 through January 2023, the monthly correlation of CCLFX to VOO was 0.58 and its monthly correlation to VFITX was -0.18; and
Reinsurance risk strategies that are uncorrelated to both stocks and bonds (such as provided by Stone Ridge’s Reinsurance Risk Premium Interval Fund, SRRIX, and Amundi’s Pioneer ILS Interval Fund, XILSX). From January 2015 through January 2023, the monthly correlation of XILSX (data was not available for SRRIX) to VOO was 0.02 and its monthly correlation to VFITX was 0.07.
Larry Swedroe has authored or co-authored 18 books on investing. His latest is “Your Essential Guide to Sustainable Investing.” All opinions expressed are solely his opinions and do not reflect the opinions of Buckingham Strategic Wealth or its affiliates. This information is provided for general information purposes only and should not be construed as financial, tax or legal advice.


