
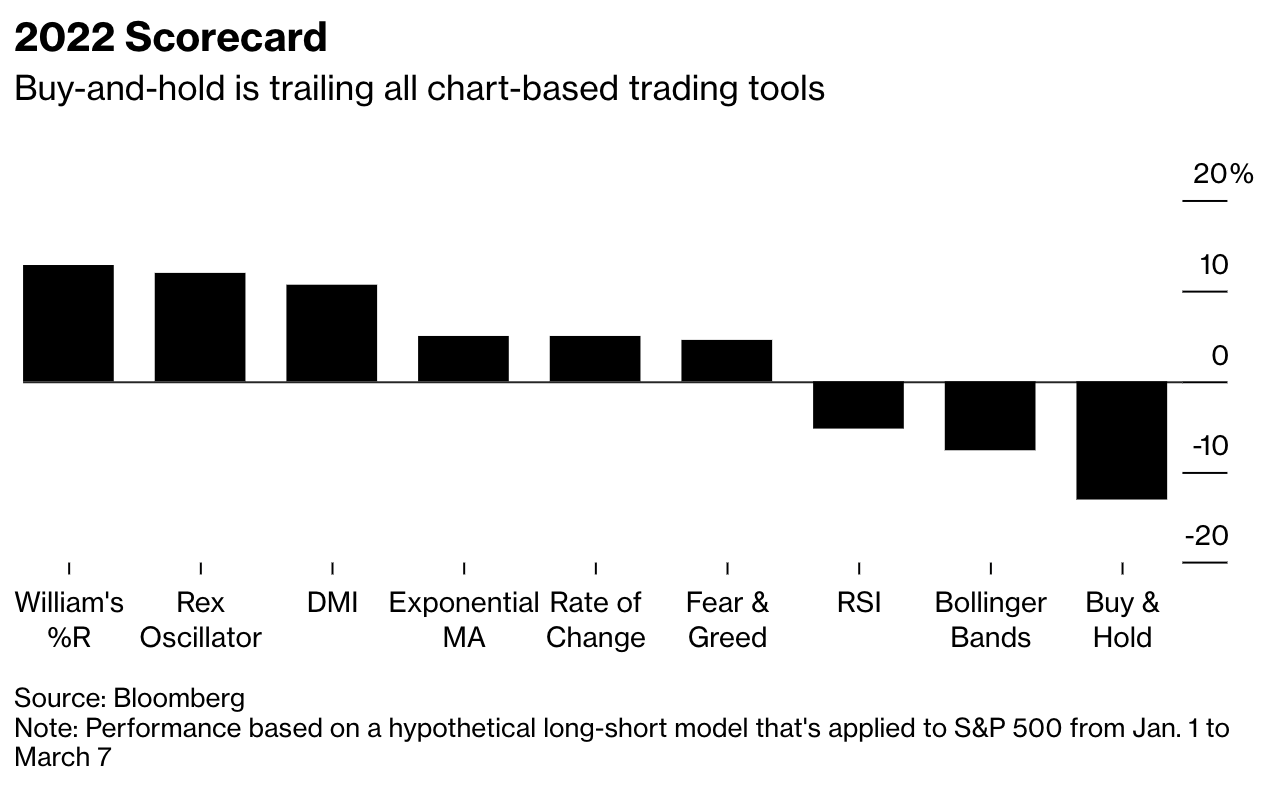
(Bloomberg) -- For an idea of how difficult 2022 has been for patient investors, consider this: Buying and holding stocks has done worse as a strategy than literally every chart-based trading model in Bloomberg’s technical-analysis library.
If you heeded the directional movement indicator, bought on fear and sold on greed, or took signals from an exponential moving average, you did better than doing nothing, back-testing data show. Buy-and-hold is down more than 10%, losing to 22 TA systems, 12 of which delivered positive returns.
Demand for any kind of edge has grown as volatility ramped in 2022’s stock market. Wild intraday reversals are piling up as traders struggle to get a handle on the future path of interest rates and the economy, with the war in Ukraine sparking a rally in commodities and complicating the Federal Reserve’s calculus on monetary policy.
Before getting too enamored of the charts, realize that any methodology that kept someone out of the market at all this year -- or helped them miss the big down days -- was destined to do well compared with riding the S&P 500 Index to the bottom. Beating a market in free fall isn’t hard, and equities have dropped on many more days than they’ve risen in 2022.
“There is a chicken-and-egg question here: Is technical analysis working because it is good, or does the market happen to be doing something that technical analysis is picking up?” said Lawrence Creatura, a fund manager at PRSPCTV Capital LLC. “That’s an unanswerable question.”
This year’s volatility has also lent itself to a more tactical posture, with chart levels like moving averages seeming to exhibit an uncommon pull amid the riptide created by war in Europe and the Fed’s heightened hawkishness. Technical analysis might be proving itself prescient -- or it might just be exerting self-fulfilling force, as hordes of traders pile into it in the absence of anything else to premise a view on.
Read: Chaos-Craving Traders Leap Into Action as Nasdaq Swings Double
To be sure, investors almost never use these charting tools in isolation without considering the fundamental picture. And rarely does a single technical study account for all investment decisions.
Still, the reward from avoiding just a few bad days appears higher than ever. Absent the worst five sessions, the S&P 500’s 12% loss this year dwindles to 1%.
“You have to acknowledge where you are and what tools to use,” said Larry Williams, 79, creator of the Williams %R indicator that’s designed to capture a shift in a security’s momentum. A long-short strategy based on the technique is up 13% since the end of December.
“In a trending market, you don’t have any highs and lows to catch, you just go one direction,” and that was the case in 2021, he added. This year, “we have not been in a one-directional market. We’ve been very choppy -- big up swings and down swings. So in that situation, technical analysis, maybe even Williams %R, will prevail.”
Bloomberg’s back-testing model purchases the S&P 500 when an indicator signals a “buy” and holds it until a “sell” is generated. At that time, the index is sold and a short position is established and kept until a buy is triggered.
A strategy following DMI signals is up 11% this year. The profit came as the S&P 500 started January with a string of lower lows that triggered an order to sell. The trade has since been in place as the index failed to post a higher high that’s strong enough to flash buy.
The exponential moving average indicator has produced a gain of 5%. Two of the five trading signals that the model has produced were buys, and neither made money. Among the sell recommendations, only one didn’t work out.
As encouraging as this year’s reporting card looked for technical analysis, Williams, who has been trading since 1962, cautions against taking a victory lap.
“I don’t expect anything is going to work all the time, especially in this business where there’s so much randomness,” he said. “I’ve always said you can’t rely on just technical stuff. You have to look at a combination of things, including fundamentals.”


