This report identifies the “best” ETFs and mutual funds based on the quality of their holdings and their costs. As detailed in “Low-Cost Funds Dupe Investors”, there are few funds that have both good holdings and low costs. While there are lots of cheap funds, there are very few with high-quality holdings.
Without speculating on the cause for this disconnect, I think it is fair to say that there is a severe lack of quality research into the holdings of mutual funds and ETFs. There should not be such a large gap between the quality of research on stocks and funds, which are simply groups of stocks.
After all, investors should care more about the quality of a fund’s holdings than its costs because the quality of a fund’s holdings is the single most important factor in determining its future performance.
My Predictive Rating system rates 6900+ mutual funds and ETFs according to the quality of their holdings (portfolio management rating) and their costs (total annual costs rating).
The following is a summary of my top picks and pans for all style ETFs and mutual funds. I will follow this summary with a detailed report on each style, just as I did for each sector.
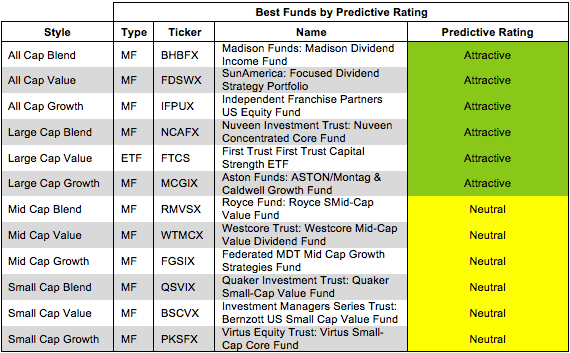
Figure 1 shows the best ETF or mutual fund in each investment style as of October 15, 2013. Investors looking for style funds should focus on large cap and all cap funds, as only those styles contain Attractive funds.
For a full list of all ETFs and mutual funds for each investment style ranked from best to worst, see our freeETF and mutual fund screener.
Figure 1: Best ETFs and Mutual Funds In Each Style
 Source: New Constructs, LLC and company filings
Sun America Focused Series: Focused Dividend Strategy Portfolio (FDSWX) is my top-rated All Cap Value fund and the number one rated fund out of all the style ETFs and mutual funds I cover. FDSWX allocates over 70% of its assets to Attractive-or-better rated stocks. It also has below-average fees for a mutual fund. Its total annual costs are only 0.92%.
McDonald’s (MCD) is one of my favorite stocks held by FDSWX and earns my Attractive rating. MCD has a track record of consistent growth. It has increased its operating profit (NOPAT) by 12% compounded annually over the past ten years. As I wrote in June, McDonald’s has an edge in scale and efficiency over competitors like YUM! Brands (YUM), Wendy’s (WEN), and Burger King (BKW). The $3 billion MCD is investing in new stores and renovations this year show its commitment to keep growing worldwide. Despite its impressive track record, MCD is valued cheaply. At ~$94/share, MCD has a price to economic value ratio of just under 1, which means the market is actually expecting a slight permanent decline in NOPAT. Few stocks can offer the same combination of a high-performing company and an attractive stock valuation.
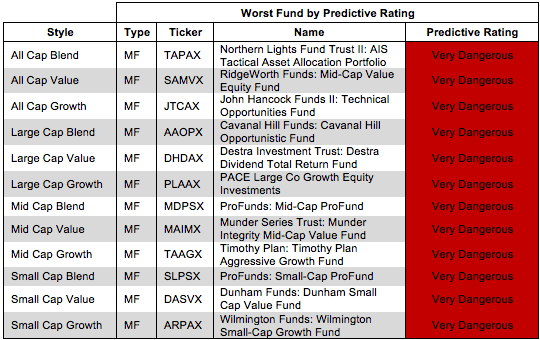
Figure 2 shows the worst ETF or mutual fund for each investment style as of October 15, 2013. Every style has Very Dangerous funds that can hurt investors.
Dangerous-or-worse-rated funds have a combination of low-quality portfolios (i.e. they hold too many Dangerous-or-worse rated stocks) and high costs (they charge investors too much for the [lack of] management they provide).
Figure 2: Worst ETFs and Mutual Funds In Each Style
 Source: New Constructs, LLC and company filings
ProFunds: Mid-Cap ProFund (MDPSX) is my worst-rated Mid Cap Blend fund and earns my Very Dangerous rating. MDPSX allocates only 6% of its value to Attractive-or-better rated stocks and charges investors high total annual costs of 5.18%. Even worse, MDPSX holds nearly 40% of its assets in cash. Innvestors should not pay such high fees for a fund manager to do nothing with their cash.
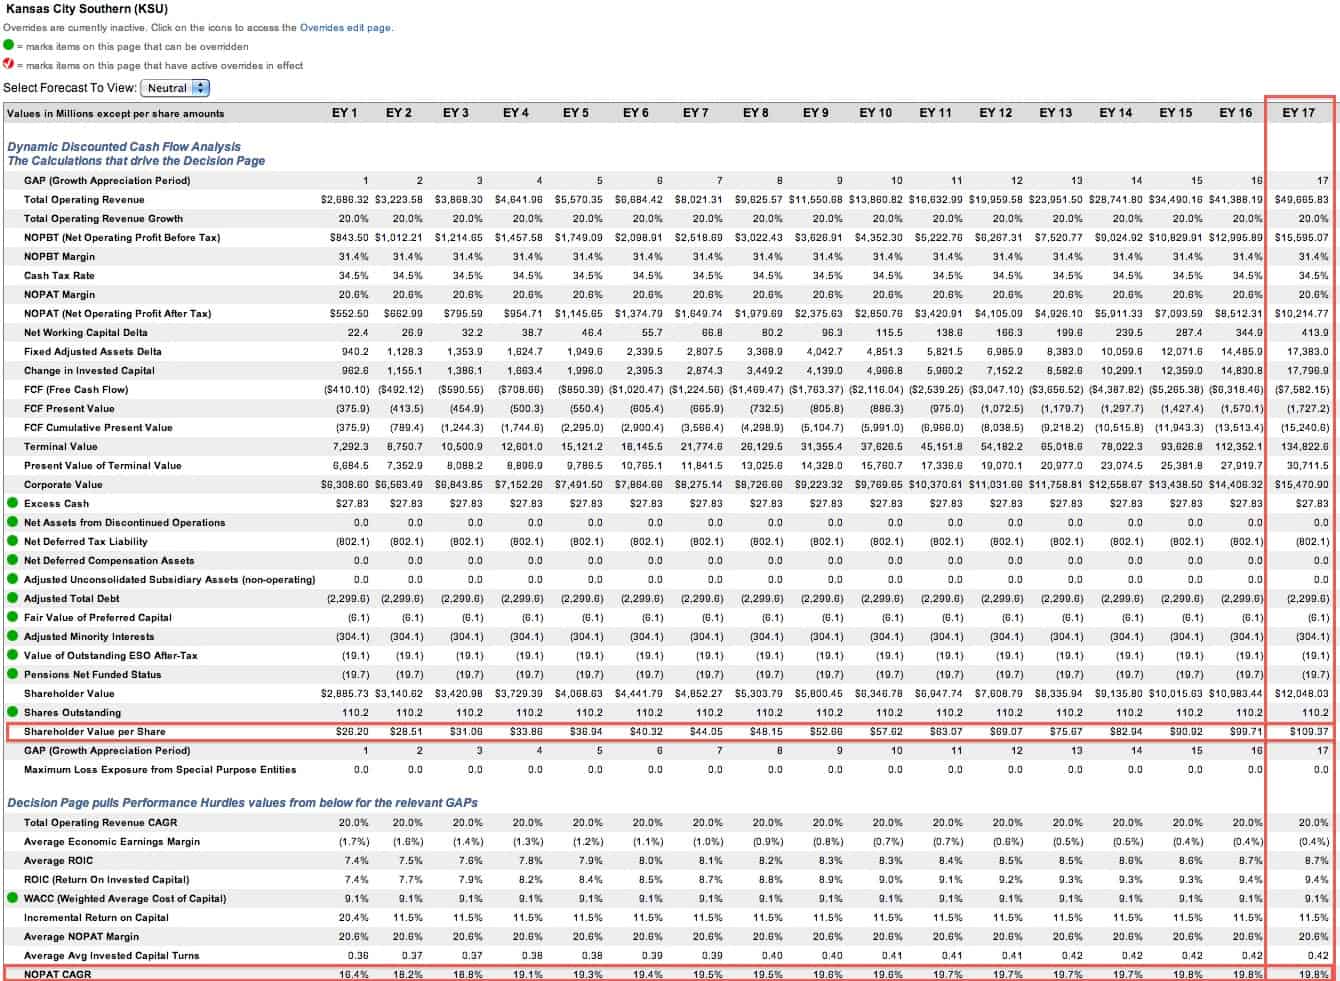
Kansas Southern (KSU) is one of my least favorite stocks held by MDPSX and earns my Dangerous rating. KSU’s 7% return on invested capital (ROIC) compares unfavorably to competitors such as CSX (8%), UNP (9%) and RAIL (12%). KSU’s ROIC is below its weighted average cost of capital (WACC) of 9%, so the company is making negative economic earnings. KSU has made negative economic earnings ever year since 2000.
The real danger for KSU, however, lies in its valuation. To justify its current valuation of ~$111/share, KSU would need to grow NOPAT by 20% for 17 years. I would not want to invest in even the most profitable company at that level of valuation. KSU looks destined to come up short of the market’s high expectations.
Traditional mutual fund research has focused on past performance and low management costs. The quality of a fund’s holdings has been ignored. Our portfolio management rating examines the fund’s holdings in detail and takes into account the fund’s allocation to cash. Our models are created with data from over 40,000 annual reports. This kind of diligence is necessary for understanding just what you are buying when you invest in a mutual fund or an ETF.
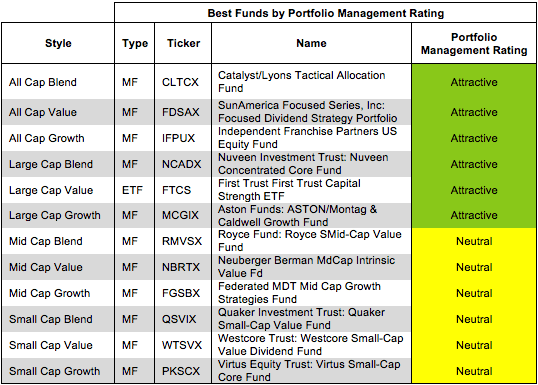
Figure 3 shows the best fund based on our Portfolio Management Rating for each investment style as of October 15, 2013. Again, the Attractive funds are located in the large and mid cap styles.
Attractive-or-better-rated funds own high-quality stocks and hold very little of the fund’s assets in cash – investors looking to hold cash can do so themselves without paying management fees. Less than 1% of funds receive our Attractive or Very Attractive ratings, so investors need to be cautious when selecting a mutual fund or ETF – there are thousands of Neutral-or-worse-rated funds.
Figure 3: Style Funds With Highest Quality Holdings
 Source: New Constructs, LLC and company filings
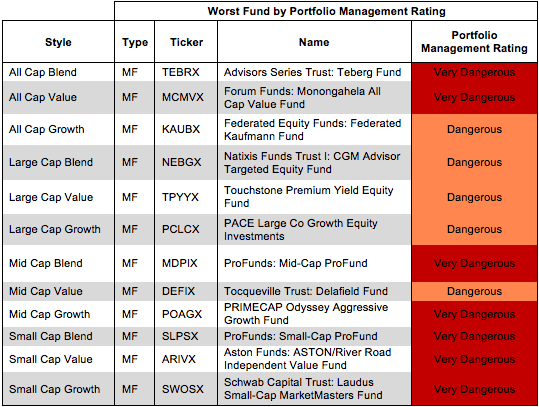
Figure 4 shows the worst fund based on our Portfolio Management Rating for each investment style as of October 15, 2013.
The worst fund for each investment style is an actively managed mutual fund; none of the worst investment style funds are passively managed ETFs. Investors pay mutual fund managers to pick stocks for them. Even ignoring costs, these mutual fund managers do a poor job investing money for their clients.
Figure 4: Style Funds With Lowest Quality Holdings
 Source: New Constructs, LLC and company filings
Investors should care about all of the fees associated with a fund in addition to the quality of the fund’s holdings. The best funds have both low costs and quality holdings – and there are plenty of low cost funds available to investors.
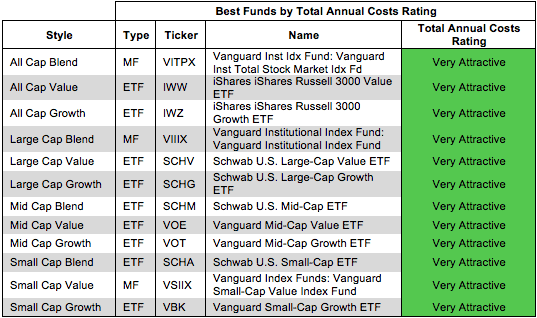
Figure 5 shows the best fund in each investment style according to our total annual costs rating. An ETF ranks as the lowest cost for nine of the twelve style categories, and the three mutual funds are all Vanguard index funds.
Total Annual Costs incorporates all expenses, loads, fees, and transaction costs into a single value that is comparable across all funds. Passively managed ETFs and index mutual funds are generally the cheapest funds.
Figure 5: Style Funds With Lowest Costs
 Source: New Constructs, LLC and company filings
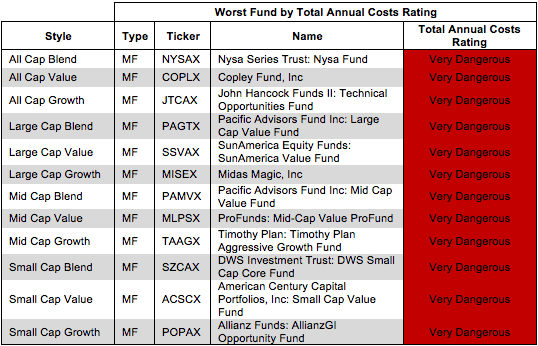
The most expensive fund for each investment style has a Very Dangerous Total Annual Costs Rating. Investors should avoid these funds and other funds with a Very Dangerous Total Annual Costs Ratings because they charge investors too much. For every fund with a Very Dangerous Total Annual Costs Rating there is an alternative fund that offers similar exposure and holdings at a lower cost. We cover over 6900 mutual funds and over 400 ETFs. Investors have plenty of alternatives to these overpriced funds.
Figure 6 shows the worst fund in each investment style according to our total annual costs rating. No ETFs ranks as the most expensive for any style category.
Figure 6: Style Funds With Highest Costs
 Source: New Constructs, LLC and company filings
Sam McBride contributed to this report
Disclosure: David Trainer is long MCD. I receive no compensation to write about any specific stock, sector or theme.