Picking from the multitude of style mutual funds is a daunting task. In any given style there may be as many as 979 different mutual funds, and there are at least 6100 mutual funds across all styles.
Why are there so many mutual funds? The answer is: because mutual fund providers are making lots of money selling them. The number of mutual funds has little to do with serving investors’ best interests. Below are three red flags investors can use to avoid the worst mutual funds:
- Inadequate liquidity
- High fees
- Poor quality holdings
I address these red flags in order of difficulty. Details on the best & worst mutual funds in each style are here.
How To Avoid Mutual Funds with Inadequate Liquidity
This is the easiest issue to avoid, and my advice is simple. Avoid all mutual funds with less than $100 million in assets. Low asset levels tend to mean lower volume in the mutual fund and large bid-ask spreads.
How To Avoid High Fees
Mutual funds should be cheap, but not all of them are. The first step here is to know what is cheap and what is expensive.
To ensure you are paying at or below average fees, invest only in mutual funds with an expense ratio below 2.45%, which is the average expense ratio of the 6732 U.S. equity mutual funds I cover. Weighting the expense ratios by assets under management, the average expense ratio is lower at 1.20%. A lower weighted average is a good sign that investors are putting money in the cheaper mutual funds.
Figure 1 shows the most and least expensive style mutual funds in the U.S. equity universe based on total annual costs. The five most expensive mutual funds are split across styles and providers, while four of the cheapest are in the large cap blend style, and three of the five cheapest are provided by Vanguard.
Figure 1: 5 Most and Least Expensive Style Mutual Funds
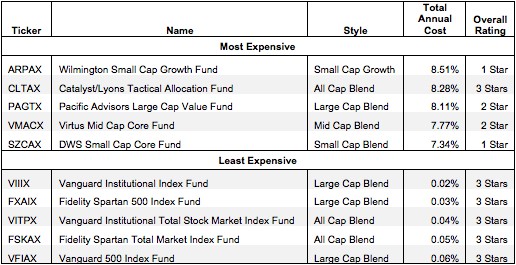 Sources: New Constructs, LLC and company filings
While costs among ETFs fall into a generally small range, mutual fund costs are more varied. The high costs of the most expensive mutual funds, sometimes above 8% annually, make it much harder for them to perform as well as the cheapest mutual funds.
The five cheapest funds in Figure 1 all have over $25 billion in assets, while Wilmington Small Cap Growth Fund (ARPAX), by far the largest of the five most expensive funds, has only $147 million in assets. This is another sign that investors are putting their money into the cheapest funds.
The five cheapest funds have higher overall ratings than the five most expensive.
However, none of the cheapest funds gets anything higher than a 3-star or Neutral rating. This result highlights why investors should not choose mutual funds based only on price. Low costs are nice, but low costs cannot generate returns — only quality holdings can.
How To Avoid Mutual Funds with the Worst Holdings
This step is by far the hardest, but it is also the most important because a mutual fund’s performance is determined more by its holdings than its costs. Figure 2 shows the mutual funds within each style with the worst holdings or portfolio management ratings. The styles are listed in descending order by overall rating as detailed in my 2Q13 Style Rankings report.
Figure 2: Style Mutual Funds with the Worst Holdings
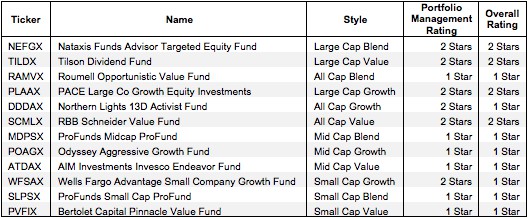 Sources: New Constructs, LLC and company filings
My overall ratings on mutual funds are based primarily on my stock ratings of their holdings. My firm covers over 3000 stocks and is known for the due diligence done on each stock we cover.
ProFunds is the only recurring provider in Figure 2, offering the mutual funds with the worst holdings in the small cap blend and mid cap blend styles. Other than ProFunds, no single provider has more than one mutual fund in Figure 2.
Note that no mutual funds with a Dangerous (or 2-star) portfolio management rating earn an overall rating better than two stars. These scores are consistent with my belief that the quality of a mutual fund is more about its holdings than its costs. If the mutual fund’s holdings are Dangerous, then the overall rating cannot be better than Dangerous because one cannot expect the performance of the fund to be any better than the performance of its holdings.
Find the mutual funds with the worst overall ratings on my mutual fund screener. More analysis of the Best Sector mutual funds is here.
The Danger Within
Buying a mutual fund without analyzing its holdings is like buying a stock without analyzing its business and finances. As Barron’s says, investors should know the Danger Within. Put another way, research on mutual fund holdings is necessary due diligence because a mutual fund’s performance is only as good as its holdings’ performance.
PERFORMANCE OF MUTUAL FUND’s HOLDINGs = PERFORMANCE OF MUTUAL FUND
Best & Worst Stocks In These Mutual Funds
Hallmark Financial Services (HALL) is one of my least favorite stocks held by Bertolet Capital Pinnacle Value Fund (PVFIX) and earns my Dangerous rating. Hallmark Financial has earned negative economic earnings for three years running now. In addition, Hallmark’s after-tax profits (NOPAT) have declined at 8% compounded annually since 2004 and its return on invested capital (ROIC) of 1.4% from the last fiscal year is in the bottom quintile of all companies I cover. One would think investors would be wary of a business that has actually declined in profitability the past 8 years, but the market has HALL priced for massive growth. To justify its current valuation of ~$9.25/share, HALL would need to grow NOPAT by 18% compounded annually for 17 years. PVFIX has allocated over 4% of its holdings to Aspen Technologies, putting it in the fund’s top five holdings. Investment decisions in low ROIC and overvalued stocks earn PVFIX its Very Dangerous portfolio management rating and Very Dangerous rating overall.
Xilinx, Inc. (XLNX) is one of favorite holdings in Catalyst/Lyons Tactical Allocation Fund (CLTAX), the only high-cost mutual fund in Figure 1 to get my 3-star rating. This stock gets my Attractive rating. Xilinx has grown NOPAT by 13% compounded annually since 1998. Xilinx also boasts an outstanding return on invested capital of 32%, putting it in the top quintile of all companies I cover. The company has earned positive economic earnings every year since 2004. Despite these solid fundamentals, XLNX is modestly priced. At ~$39.49/share, XLNX has a price to economic book value ratio of 1.3, implying that the company’s NOPAT will never exceed its current level by more than 30%. CLTAX’s allocation to Attractive stocks with strong fundamentals, like its 4.1% to XLNX, earn it my Neutral rating despite its exorbitant costs.