This report is one of a series on the adjustments we make to convert GAAP data to economic earnings.
Reported earnings don’t tell the whole story of a company’s profits. They are based on accountingrules designed for debt investors, not equity investors, and are manipulated by companies to manage earnings. Only economic earnings provide a complete and unadulterated measure of profitability.
Converting GAAP data into economic earnings should be part of every investor’s diligence process. Performing detailed analysis of footnotes and the MD&A is part of fulfilling fiduciary responsibilities.
We’ve performed unrivalled due diligence on 5,500 10-Ks every year for the past decade.
Deferred tax assets (DTAs) arise when reported income on a financial statement is less than taxable income. DTAs are, in a sense, like pre-paid taxes and represent expected reductions of future reported taxes. Deferred tax liabilities (DTLs), on the other hand, arise when reported income is greater than taxable income. DTLs represent the expected amount of additional reported taxes to be paid. These items are a result of differences between GAAP accrual accounting and tax policy. Examples of DTAs include: product warranty reserves, tax loss carry-forwards, and future pension and postretirement benefit payments. Examples of DTLs include: accelerated depreciation payments and nondeductible intangibles.
DTAs artificially raise reported assets and do not help generate operating profit while DTLs are like a source of interest-free financing. We remove the impact of DTAs and DTLs from our calculation of invested capital to ensure the more accurate measure of a firm’s return on invested capital (ROIC).
We subtract all DTAs from invested capital. We include all DTLs in invested capital. When we calculate a firm’s implied value in our DCF model, we subtract any net DTLs (DTLs minus DTAs) as they are real cash obligations on future cash flows.
DTAs and DTLs are disclosed in two ways. They are either explicitly presented as DTAs and DTLs or hidden in other line items on the balance sheet, in which case investors have to dig through the footnotes to find them.
Johnson & Johnson (JNJ) had over $7.6 billion in deferred tax assets adjusted out of invested capital for 2012. This deferred tax asset is mostly due to future employee benefit obligations that have been recorded but not paid, and that have not yet been taxed. Without this adjustment, JNJ’s invested capital would have been over $108 billion, but taking this adjustment into account brings JNJ’s invested capital down to $100 billion.
Figure 1 shows the five companies with the largest gross value of deferred tax assets and liabilities adjusted out of invested capital for 2012.
Figure 1: Companies Most Affected By Deferred Tax Assets and Liabilities
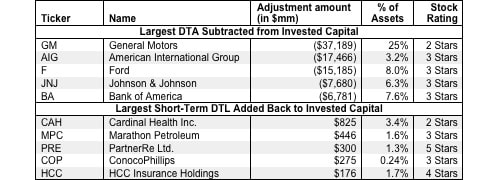
Sources: New Constructs, LLC and company filings
However, these companies are far from the only ones affected by deferred tax assets and liabilities. In the last fiscal year, DTA and DTL adjustments occurred 3075 times for 1980 different companies. Our database contains over 28460 DTA and DTL adjustments for a total adjustment value of $2.6 trillion out of invested capital and $4.9 billion back into invested capital.
Though the removal of DTAs/DTLs can lower/raise invested capital and boost/depress ROIC, this does not always mean the company’s stock will earn a favorable rating. For instance, Ford (F) still has only a 3-star or Neutral rating despite its $15 billion in adjustments out of invested capital. Likewise, PartnerRe (PRE) still earns a 5-star Very Attractive rating despite having $300 million adjusted back into invested capital.
In other cases, however, DTAs/DTLs can artificially depress/boost invested capital and make a stock look over/undervalued. Case in point: General Motors (GM) had a total of $37 billion in deferred tax liabilities in 2012, or 25% of its total assets. This huge sum was primarily due to operating loss and tax credit carry-forwards from the years of losses GM racked up before its bankruptcy. Now that GM expects to make money again, it is expecting to realize these losses as tax benefits on its new income.
GM’s net DTAs were disclosed on its balance sheet, but investors would need to go to page 151 in GM’s annual report, deep in the financial footnotes, to uncover the value and details of the company’s short and long-term DTLs. On GM’s balance sheet, these hidden DTLs are simply lumped in with “other liabilities.”
Including GM’s net DTAs in its invested capital would have raised the company’s average invested capital from $69 billion to over $106 billion. However, removing the value of these assets gives a truer representation of the capital GM currently has on hand to generate a profit. Without the adjustments, GM’s ROIC would be under 4%, but adding back the amount of the DTAs gives GM an ROIC of 6%.
While this boost in ROIC elevates GM above the bottom quintile of all companies I cover, GM’s high share price of ~$36 makes the stock too risky to receive above a 2-star Dangerous rating. Still, this example shows how due diligence can make a substantial difference when calculating a firm’s invested capital.
André Rouillard contributed to this report
Disclosure: David Trainer and André Rouillard receive no compensation to write about any specific stock, sector, or theme.