The Health Care sector ranks third out of the ten sectors as detailed in my Sector Rankings for ETFs and Mutual Funds report. It gets my Neutral rating, which is based on aggregation of ratings of 21 ETFs and 84 mutual funds in the Health Care sector as of April 17, 2013. Prior reports on the best & worst ETFs and mutual funds in every sector and style are here.
Figures 1 and 2 show the five best and worst-rated ETFs and mutual funds in the sector.
Not all Health Care sector ETFs and mutual funds are created the same. The number of holdings varies widely (from 20 to 292), which creates drastically different investment implications and ratings. The best ETFs and mutual funds allocate more value to Attractive-or-better-rated stocks than the worst ETFs and mutual funds, which allocate too much value to Neutral-or-worse-rated stocks.
To identify the best and avoid the worst ETFs and mutual funds within the Health Care sector, investors need a predictive rating based on (1) stocks ratings of the holdings and (2) the all-in expenses of each ETF and mutual fund. Investors need not rely on backward-looking ratings. My fund rating methodology is detailed here.
Investors should not buy any Health Care ETFs or mutual funds because none get an Attractive-or-better rating and meet our $100 million liquidity standard. If you must have exposure to this sector, you should buy a basket of Attractive-or-better rated stocks and avoid paying undeserved fund fees. Active management has a long history of not paying off.
Get my ratings on all ETFs and mutual funds in this sector on my free
Figure 1: ETFs with the Best & Worst Ratings – Top 5
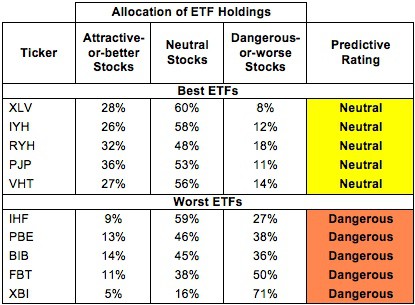
* Best ETFs exclude ETFs with TNAs less than $100 million for inadequate liquidity.
Sources: New Constructs, LLC and company filings
ProShares Ultra Health Care (RXL) is excluded from Figure 1 because its total net assets (TNA) are below $100 million and do not meet our liquidity standards.
Figure 2: Mutual Funds with the Best & Worst Ratings – Top 5
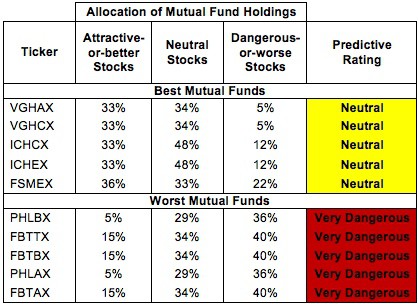
* Best mutual funds exclude funds with TNAs less than $100 million for inadequate liquidity.
Sources: New Constructs, LLC and company filings
Oak Associates Funds: Live Oak Health Sciences Fund (LOGSX) and Saratoga Advantage Trust: Health & Biotechnology Portfolio (SBHIX) are excluded from Figure 2 because their total net assets (TNA) are below $100 million and do not meet our liquidity standards.
Health Care Select Sector SPDR (XLV) is my top-rated Health Care ETF and Vanguard Health Care Fund (VGHAX) is my top-rated Health Care mutual fund. Both earn my Neutral rating.
SPDR S&P Biotech ETF (XBI) is my worst-rated Health Care ETF and Fidelity Advisor Biotechnology Fund (FBTAX) is my worst-rated Health Care mutual fund. XBI earns my Dangerous rating and FBTAX earns my Very Dangerous rating.
Figure 3 shows that 54 out of the 330 stocks (over 32% of the market value) in Health Care ETFs and mutual funds get an Attractive-or-better rating. And yet, no Health Care ETFs allocate enough value to Attractive-or-better rated stocks to earn an Attractive rating. Only 2% of assets in Health Care mutual funds are allocated to Attractive rated funds.
The takeaways are: mutual fund managers allocate too much capital to low-quality stocks and Health Care ETFs hold poor quality stocks. I find it a bit appalling that despite all the high quality stocks in the sector there are no Attractive or better ETFs and only 2 Attractive mutual funds.
Figure 3: Health Care Sector Landscape For ETFs, Mutual Funds & Stocks
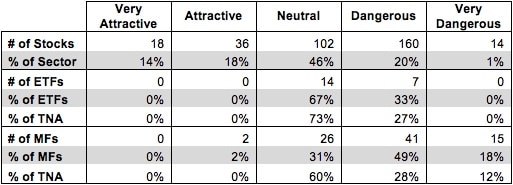
Sources: New Constructs, LLC and company filings
As detailed in “Cheap Funds Dupe Investors”, the fund industry offers many cheap funds but very few funds with high-quality stocks, or with what I call good portfolio management.
Investors need to tread carefully when considering Health Care ETFs and mutual funds, as the bad outweighs the good in this sector. No ETFs and only two mutual funds in the Health Care sector allocate enough value to Attractive-or-better-rated stocks to earn an Attractive rating.
St. Jude Medical (STJ) is one of my favorite stocks held by Health Care ETFs and mutual funds and earns my Very Attractive rating. St. Jude’s track record of growth is impressive. Over the past 14 years STJ has grown after tax profit (NOPAT) by 17% compounded annually. This helps to drive the company’s top quintile return on invested capital (ROIC) of 15%. This rising profitability stands in contrast to GAAP net income, which has declined over the past two years. High non-operating expenses have kept STJ’s reported income down. Our proprietary research platform enables us to sort through the mountain of data in footnotes, remove these non-operating expenses, and get a truer sense of the profitability of the company. STJ’s declining reported income helps to explain why it is valued so cheaply. At ~$42.14/share, STJ has a price to economic book value ratio of 0.8, implying a permanent 20% decline in NOPAT. Such low expectations, combined with strong historical performance, make STJ a Very Attractive stock for investors.
Express Scripts, Inc. (ESRX) is one of my least favorite stocks held by Health Care ETFs and mutual funds and earns my Dangerous rating. Potential overvaluation of intangible assets and ignored liabilities (such as off-balance sheet debt, employee stock options, and underfunded pensions) help to make this company appear much more valuable than it is. In truth, the company invested a great deal of capital in acquiring MedCo Health Solutions in 2012 without getting back a great deal in cash flow, decreasing itsROIC to only 6%. However, optimism over the acquisition has helped drive the valuation of ESRX to ~$56.19/share. To justify this valuation, ESRX would have to grow NOPAT by 7% compounded annually for 16 years. That’s a tall ask for any company, especially one that such a low ROIC. For more details on my analysis of ESRX, see “Danger Zone 4/1/13: Express Scripts, Inc.”
382 stocks of the 3000+ I cover are classified as Health Care stocks, but due to style drift, Health Care ETFs and mutual funds hold only 330 stocks.
Figures 4 and 5 show the rating landscape of all Health Care ETFs and mutual funds.
My Sector Rankings for ETFs and Mutual Funds report ranks all sectors and highlights those that offer the best investments.
Figure 4: Separating the Best ETFs From the Worst ETFs
 Sources: New Constructs, LLC and company filings
Figure 5: Separating the Best Mutual Funds From the Worst Mutual Funds
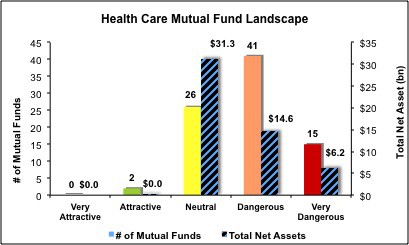 Sources: New Constructs, LLC and company filings
Review my full list of ratings and rankings along with reports on all 21 ETFs and 84 mutual funds in the Health Care sector.
Sam McBride contributed to this report.
Disclosure: David Trainer and Sam McBride receive no compensation to write about any specific stock, sector or theme.