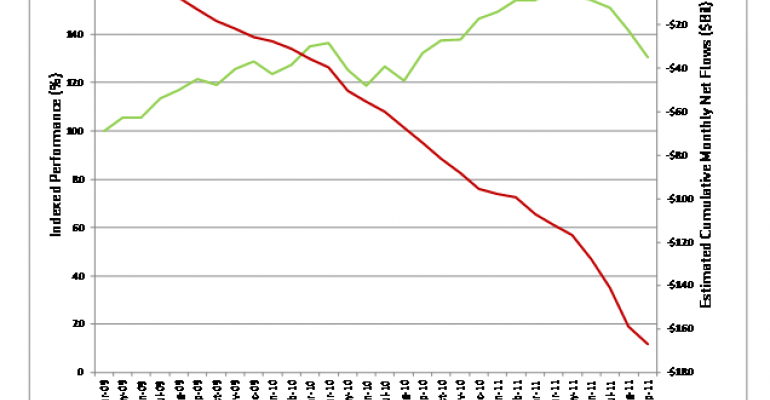
Charts that show one line heading for a clear upward trend and another line crossing over and plunging to a clear negative trend always make for great cocktail hour conversation. And Lipper's chart of the week shows that despite the fact that large-cap funds are up 30 percent since April 2009 (the green line), these funds have seen their 28th straight month of
net outflows as of September (red line). Investors have redeemed $169.9 billion from large-cap funds for the period shown.
Personally, I believe this dramatic shift is a matter of scared investors running for the hills. Lipper also acknowledges this possibility. The last two years have been characterized by slow growth and now extreme stock market volatility. They're confused. Who can blame them?
Tom Roseen, head of research services at Lipper, on the other hand, has a different perspective:
We at Lipper don’t think this is a vote against large-cap funds per se but is instead a reallocation from an old core-and-satellite investment strategy using large-cap issues for the main focus of portfolios. The outflows could have resulted from investors being badly burned by some of the large-cap names after the recent financial services debacle or by the problems with the big-three automakers. But, looking at the allocation trends over the years, it appears investors are just broadening their investment choices. At the end of 1979 the average large-cap fund accounted for 59% of investors’ equity fund allocation, while as of September 30, 2011, the allocation to large-cap funds had declined to 19% of U.S. investors’ equity allocation. So, while we have not seen a monthly net inflow into large-cap funds since May 2009, we have seen net inflows into Lipper’s World Equity Funds and Mixed-Asset Funds macro-classifications, which both have become a significant portion of the average U.S. investor’s equity allocation scheme.

