

It hasn’t paid to bet against real estate in 2013. Let me clarify that. A wager against domestic (U.S.) realty wouldn’t have won you any chips this year.
True, the returns tallied by exchange-traded products haven’t matched the gains of the broader equity market, but they’re still positive. At least for now.
Where’s the money?
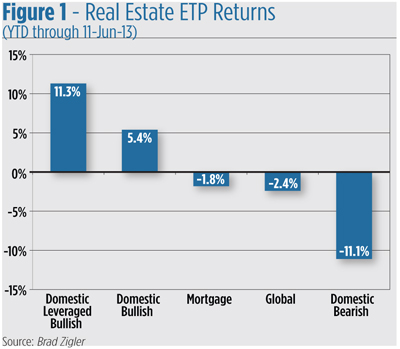
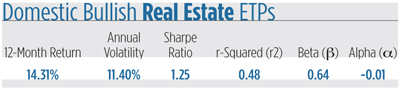
ETPs owning U.S. properties (through real estate investment trusts mostly) posted a market-weighted 5.4 percent total return through mid June (see Figure 1). That’s where the lion’s share of the category’s capital is parked. Of the nearly three dozen real estate ETPs now on the market, only 15 are plain vanilla portfolios but they hold 76 percent of all the assets.
Among them, the biggest by far is the Vanguard REIT ETF (NYSE Arca: VNQ). Nearly half (46 percent) of all the dollars invested in real estate ETPs are held by VNQ. The stepdown to the next-biggest ETP is a steep one, too. Second place goes to another domestic portfolio, the iShares Dow Jones US Real Estate Fund (NYSE Arca: IYP) with a 13 percent market share (see Figure 2).
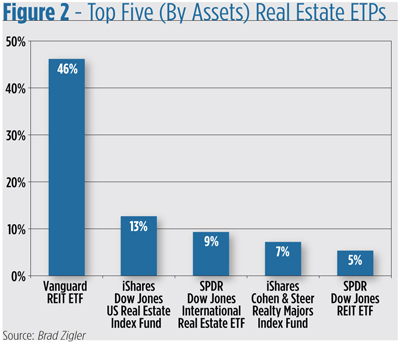
Of the $41 .2 billion invested in real estate ETPs, $24.2 billion is held in these two securities alone. What makes these products so popular? In a word, yield.
The trailing 12-month cash throwoff for the real estate market leaders averages 3.4 percent, better than most equity dividends and bond coupons. The yield on the Barclays Aggregate Bond Index -- a composite of corporate and government issues -- is just 2.4 percent while S&P 500 stocks pay out only 2.0 percent.
There’s, of course, the capital appreciation potential in these real estate ETPs as well. Remember real estate’s go-go years prior to the 2007 collapse? Leading up to the precipice, VNQ’s price was rising more than twice as fast as the S&P 500.
What comes up fast, we’ve relearned time and again, can come down fast. And sure enough, the bellwether Vanguard portfolio screamed to the downside along a more protracted and ultimately steeper trajectory -- vis-à-vis the S&P -- before bottoming in 2009.
For that reason and more, portfolio managers and advisors are concerned about real estate as a risk diversifier. Lately, it seems real estate has been moving towards a lock step with other asset classes. In the past year, for example, the correlation of domestic real estate ETPs to the S&P 500 has been 0.69 but it’s been nudging even higher since New Year’s Day 2013. Even against bonds, correlation’s on the rise. This year, domestic real estate ETPs’ coefficient versus the Barclays U.S. Aggregate Bond Index has flipped from negative to positive. Holding real estate’s becoming riskier.
There’s more than one stripe on the real estate tiger, of course, so it’s well worth a closer look at this volatile animal to see where the risks and opportunities may lie.
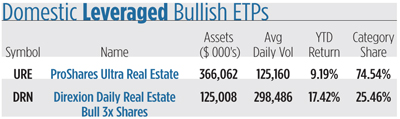
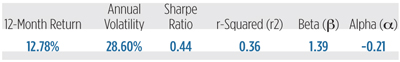
Leveraging real estate exposure, as with any other asset class, amps up returns. Two ETPs employ derivatives and borrowings to get double or triple dosages. With the vast majority of assets parked in the ProShares Ultra Real Estate ETF (NYSE Arca: URE), the category’s collective year-to-date return is twice that of unlevered portfolios. Due to volatility and compounding, though, leveraged funds lag behind their vanilla cousins on a 12-month basis.
Leveraged bull portfolios take up a scant 1.1 percent of the real estate ETP landscape.
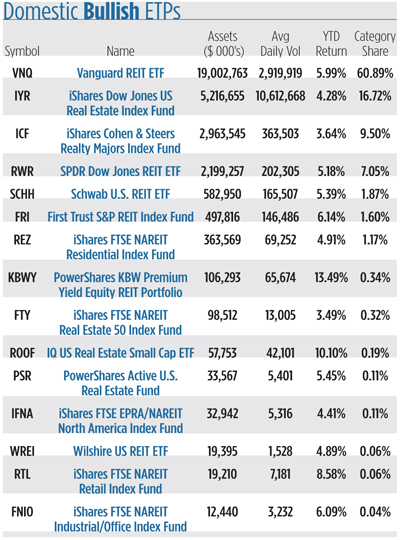
With a 60 percent market share, VNQ drives this category’s overall return.VNQ’s trailing 12-month return is better than 15 percent, but it’s actually a rather middling performance. At the top is the PowerShares KBW Premium Yield Equity REIT Portfolio (NYSE Arca: KBWY) which snagged a 34 percent gain since June 2012. The laggard, the iShares Cohen & Steers Realty Majors Index Fund (NYSE Arca: ICF), netted barely more than 11 percent over the past 12 months.
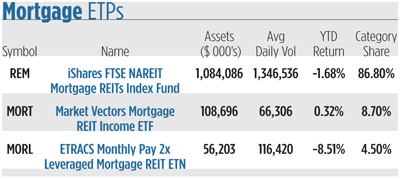
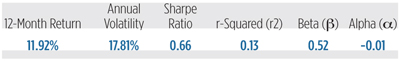
ETPs tracking mortgage REITs make up three percent of the field’s market capitalization. The overhelming majority of assets are held by the iShares FTSE NAREIT Mortgage REITs Index Fund (NYSE Arca: REM), a fund that’s risen 3.9 percent over the past 12 months. As you can see, however, the fund’s fallen on hard times since the beginning of 2013. The comedown for the Market Vectors Mortgage REIT Income ETF (NYSE Arca: MORT) has been even more dramatic. On a 12-month basis, MORT’s up seven percent, but is pretty much flat year to date.
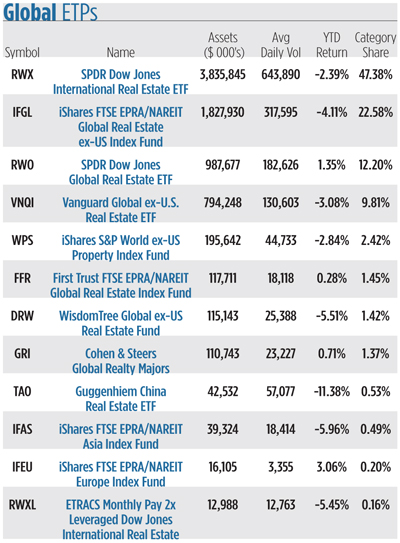
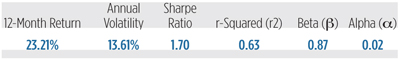
Boasting a dozen entries, international real estate is the second most populous category in the field and accounts for nearly 20 percent of total ETP assets. Year to date, global products have lost 2.4 percent, mirroring the return of the category’s big fish, the SPDR Dow Jones International Real Estate ETF (NYSE Arca: RWX). There’s a fair amount of variance in the global products’ year-to-date returns. The real bleeder’s been the Guggenheim China Real Estate ETF (NYSE Arca: TAO) which has given up 11.4 percent since New Year’s Day. That loss is even more dramatic when you consider TAO’s 12-month track record is a 20.8 percent gain. An even more stunning turnaround marks the category’s lone exchange-traded note. The ETRACS Monthly Pay 2x Leveraged Dow Jones International Real Estate ETN (NYSE Arca: RWXL) has chalked up a 52.3 percent gain over 12 months, but has lost 5.5 percent year to date, yet more evidence of the sharpness of leverage’s double-edged sword.
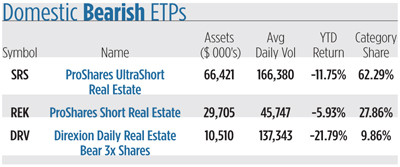
Accounting for a barely perceptible 0.3 percent of ETP assets, three portfolios make up the bearish category. Returns average -11.1 percent on a market-weighted basis this year, a seeming misery ‘til you note the funds have lost 25.5 percent on a 12-month basis.
Investors seem to like leverage for their bearish bets. Not too much, mind you; just enough. Most of the category assets are held by the ProShares UltraShort Real Estate ETF (NYSE Arca: SRS), a double-short portfolio. The more heavily levered Direxion Daily Real Estate Bear 3x Shares (NYSE Arca: DRV) snags a market share of just ten percent.
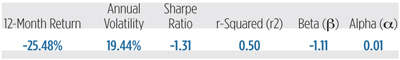
There’s, perhaps, some explanation necessary about the bearish portfolios’ 12-month statistics. Even though these products produced losses, they earn a positive alpha coefficient. How so, you may ask.
To understand this you have to recall that an inverse, or bearish, instrument is a hedge. When added to a portfolio -- one with positive beta -- it reduces overall risk. Ergo the negative beta. Alpha represents an instrument’s return compared to its risk- (beta-) adjusted benchmark (in this case the S&P 500). From that perspective, positive alpha reflects the effectiveness of the bearish funds as portfolio insurance.
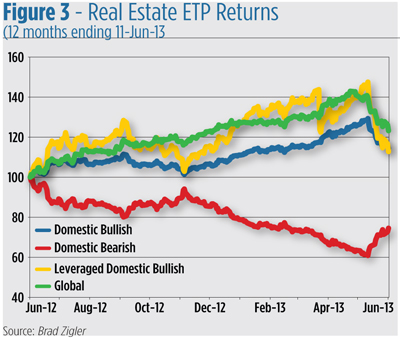
The tale of the tape’s told in Figure 3. Real estate’s clearly fallen off its highs in 2013, though the swoon’s only recently been perceived by investors. All of the categories (except, of course, bearish ETPs) are trending lower, though some slipped earlier than others. Mortgage ETPs signaled a turn in March as jawboning about a curtailment of the Fed bond buying program began. Leveraged products reacted, to no one’s surprise, with volatility, first pitching downward, then pulling up to new highs before another sickening plunge. By May, all the bullish categories were slumping. Bearish products, meantime, have dusted themselves off and begun to rally.
In sum, real estate is pretty much mirroring the downturn in the equity market albeit with greater vengeance. All of which makes a portfolio manager wonder what diversification benefit a real estate allocation delivers.
Not as much as you’d expect.
Real estate carve-outs
Over the past 12 months and year to date, real estate has not been an alpha producer, no matter where you’d have carved out portfolio space for it. That’s not to say that you couldn’t have boosted your portfolio returns with a dollop of REITs, it’s just that you’d have picked up more-than-compensating changes in volatility.
Making room for real estate at the expense of a fixed income allocation produces better results than carving out space from the equity side.
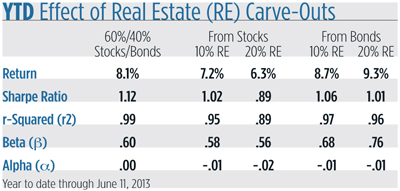
A basic portfolio weighted 60 percent stocks (proxied by the S&P 500 Index) and 40 percent bonds (represented by the Barclays U.S. Aggregate Bond Index) has risen about 8 percent this year. With its modest volatility, the portfolio earns a 1.12 Sharpe ratio.
Giving over portfolio assets from the stock side to real estate (modeled by a weighted average of domestic bullish ETPs) reduces both portfolio returns and volatility, while a carve-out from the bond side does the opposite.
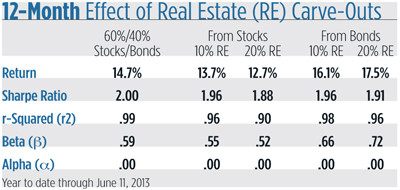
That story’s repeated if you stretch back a full year. Taking away stocks for a real estate allocation sacrifices gain for lower volatility, the mirror image of what happens when real estate is substituted for bonds.
What’s next?
In 2013, real estate bears seem to have awakened from their long hibernation. As long as fears of Fed tapering prevail, they’re likely to feed on fresh meat. You get a clue of investor and issuer shyness toward real estate from the small roster of real estate products in registration. Just four funds await a nod from the SEC now. Of course, they’re all bullish portfolios. If real estate continues to take a drubbing perhaps we’ll see more bearish products created.
Don’t hold your breath, though.
Related ETPs in registration: EG Shares Emerging Markets Real Estate ETF, Wilshire Ex-U.S. Real Estate ETF, IQ Arb Global Real Estate ETF, Wisdom Tree REIT Sector ETF.


