
In a recent engagement, an agent trying to convince a client to enter a premium financed indexed universal life (IUL) transaction was touting returns on his own IUL policy over the past decade or so. I found a number of aspects of this peculiar. One was that he was touting the average interest rate on his own policy, which has happened to be in force during the longest bull market in U.S. history. This was supposedly a reason the product was so great and could/might actually outperform the crediting rate of the sales ledger, which I already deem to be too aggressive based on significant objective data.
Another oddity is that he evidently doesn’t understand the difference between an average interest rate and the internal rate of return (IRR), which is the difference between an arithmetic mean and a geometric mean. The geometric mean will generally be lower, and it’s the number any sensible person would use when evaluating an investment. As an example, what if you get a 0% rate of return for three years and then a 40% return in the fourth year? The average rate of return is 10% but the IRR is 8.78%. It’s respectable but not accurate. No one would reasonably look at the track record of this product as 10%.
Next, the agent was sharing past rates of return that are higher than currently possible due to falling cap rates. In an IUL product, the cap rate is the highest crediting rate possible regardless of the actual index return. On the flip side, there’s a minimum, often 0%. Therefore the product is postured as having upside potential with downside protection. This is not untrue but rather misleading without a full discussion of internal policy fees and charges and what’s going on with caps.
Everyone knows that past returns aren’t indicative future performance, but that’s especially true when one takes the higher returns off the table. I’ll make a silly example of hypothetical historical returns. Let’s say that over the past 10 years, consistent great returns were limited by a falling cap. We’ll assume returns of 16%, 16%, 14%, 14%, 12%, 12%, 10%, 10%, 8% and 8%. The IRR would be 11.96%. Relating that to a prospective client when the current cap is 8% would be incredibly misleading because the cap makes the 10s, 12s, 14s, and 16s impossible. Going into the same sequence of returns with the lower capped policy will result in an 8% IRR, resulting in a 30% reduction in value from returns alone and more when incorporating expenses.
“How Caps Affect Returns,” below, is based on a recent IUL sales ledger on my desk. It shows an IRR of 8.12% for the S&P 500 Index (remember that indexes don’t include dividends that add a couple hundred basis points to the return) for the 25 years from 1994-2019. Now let’s apply caps. I’ve included what caps at 14%, 12%, 10%, 8% and 6% would do to the return. At 14% the average actually increases because removing the negative years makes a difference. However, check out the return as the cap falls.
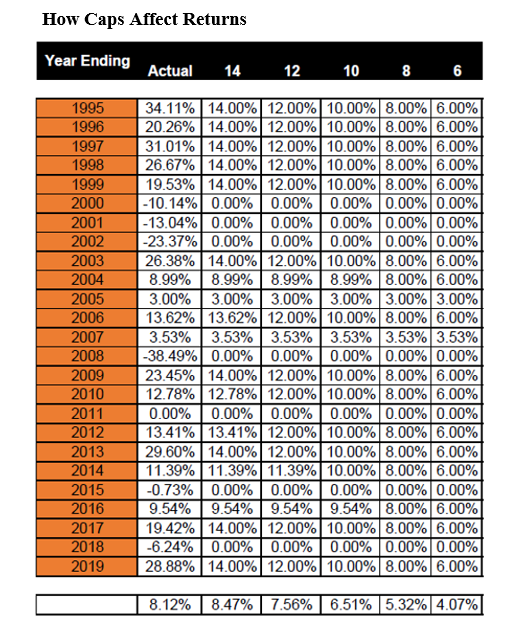
Caps are Falling
Why does this matter? Because caps are falling. I’m not going to get into a discussion on this now, but due to market volatility, changes in options budgets and pricing, etc, caps are falling meaningfully and quickly. Many that were well into the double digits are sinking through single digits now. A cap on one product that was at 17% is now at 9.75%. As seen in “How Caps Affect Returns,” this is having a huge impact on projections and crediting of products moving forward. Reductions are being announced all over and regularly. If a contract has a current cap of 9%, how ethical is it to crow about a 13% crediting years ago that’s contractually unavailable now?
The reason this affects sales ledgers and projections is because Actuarial Guideline 49 (AG 49) integrates caps into the formula for allowable crediting assumptions. A product that may have been illustrated at 9% before AG 49 might be illustrated after AG 49 at 7% but now with falling caps at 5.75%. The proposed AG 49A updated regs are meant to reign in abuses by insurance carriers who have found ways to skirt the rules since AG 49 was implemented.
Backtesting
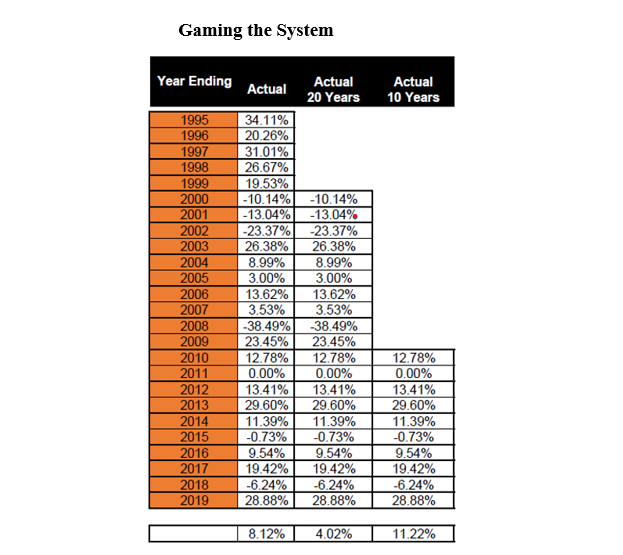
Many promoters lean heavily on backtesting, and this concept has its place. However, putting a ton of weight on it when cherry picking data can be dangerous. For example, that 25-year IRR of 8.12% is 4.02% if I look at 20 years instead. (See “Gaming the System” below) That’s the difference when you look at a data set that includes the first five years with an arithmetic mean of 26.32% rather than one that starts with a three year arithmetic mean of negative 15.52%. Let’s shorten it to 10 years. Now we jump to 11.22% IRR. This gets to be a little bit silly. We can game numbers all day long. Yes, the AG 49 rules use a 25-year backtesting rule, but does anyone think it will be front and center at a point when it doesn’t tell the desired story?
Talking about gaming, there’s a push to only apply AG 49A to policies sold after it’s effective so the same contract sold before and after a given date will illustrate differently though they‘ll operate identically. It’s like the National Highway Traffic Safety Administration discovering a deadly flaw in an automobile and not telling people who bought the car before the problem was discovered. We certainly wouldn’t want to confuse the people who purchased the car before thinking it was safe, would we?
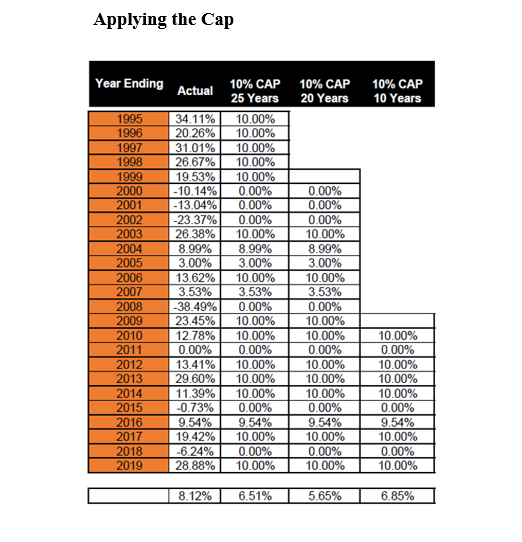
Now let’s apply a cap to these numbers. Looking only at a 10% cap, the 25-year IRR is 6.51% versus 5.65% for 20 years and 6.85% for 10 years. This is significant when realizing that a single digit basis point change on projections can spell the difference between success and failure. (See “Applying the Cap,” below.)
Being Judiciously Skeptical
Some might flip the script and say I’m the cherry picker now that we’re at the end of a historic bull market and caps are falling and regulations are changing, but I’ll push back. The very reason IUL has been so popular is because of recent stock market returns and the high caps and increasing premiums of guaranteed universal life and falling dividends of traditional whole life. The markets and marketers always chase returns or lowest perceived cost. This is why, starting about 1980, the market has pivoted from traditional whole life to universal life to variable life to guaranteed universal life to IUL. What’s easiest to sell based on what’s just happened in the market is the product with an increasing market share. It’s like clockwork, and data backs this up.
While IUL isn’t an inherently bad product and does have features some are going to appreciate and it’s an appropriate product for people with certain objectives and appropriate risk tolerances, the very fact that it’s the product du jour is reason enough to more closely scrutinize it. If we know the product with the rosiest projections of low cost and high returns is going to be the most aggressively marketed now through financing programs that make it look like it costs even less and returns even more, to jump in without independent third party analysis is absolutely insane.
These issues are only the tip of the iceberg when it comes to possible and actual manipulation of data, but at least the problems with leaning on backtesting when it looks good, misposturing averages and ignoring falling caps can be understandable to many current and potential consumers and their advisors.
Bill Boersma is a CLU, AEP and LIC. More information can be found at www.OC-LIC.com, www.BillBoersmaOnLifeInsurance.info, www.XpertLifeInsAdvice.com, www.LifeLoanRefi.com, TheNAPIC.org, www.LifeInsExpert.com or email at [email protected].