
So there I was minding my own business when Consumer Price Index came out and yields rose accordingly.
Never mind that core inflation was a still less-threatening 1.8 percent, core Personal Consumption Expenditures will likely remain so. Retail sales were very weak, the 1-year inflation outlook in the University of Michigan survey fell a bit in January; the market’s inching towards pricing in a fourth hike this year or even if Treasury Inflation Protected Securities haven’t kept up with the gain to nominals. The sky’s falling, per Chicken Little.
Inflation is back on the front burner, and if not inflation then stagflation. Stagflation is the term applied to a phenomenon of the 1970s (when something like, no one reading this article was in the market or, for that matter, fewer had even been born). CPI from 1973 to 80 averaged 8.8 percent. The UNR averaged 6.6 percent. Over 30 percent of the labor force belonged to a union and had cost-of-living-increases. The U.S. had a presidential crisis ... hmm. There was an oil embargo, which begat a quadrupling in oil prices. We had just left the gold standard. We’d played with price and wage controls. The fall of Saigon kicked us in the national psyche. Leisure suits were in; disco ruled. May we never return to those dark days.
One of the good things, in retrospect, was perhaps the lack of the sort of information and punditry overload that compels the creation of drama at every blip on a price screen today.
I’ve said for much of my career that prices generally change more than facts. In that regard, price action can have a momentum of its own. Sadly, that logic doesn’t satisfy the punditry seeking, for their soundbites, some cosmic implication that lasts for more than a few moments. Hence, the Fed, deficit, inflation vs. investors simply sitting on the sidelines until the dust clears after a few volatile weeks, leaving the high frequency crowd in command.
My point here is that the price action is running its own course and it’s looking both tired and attractive. I’m starting to really like the levels (yields), but recognize the old concept of catching a falling dagger and so I’m tepidly pushing the goalposts back. I ended 2017 thinking 10s would test 2.85 percent, pushed that back to a probe of 3 percent and hold powder dry for a bit more than that. To me, this is largely price action (not entirely I’ll admit) vs. getting some new and threatening news we didn’t already have.
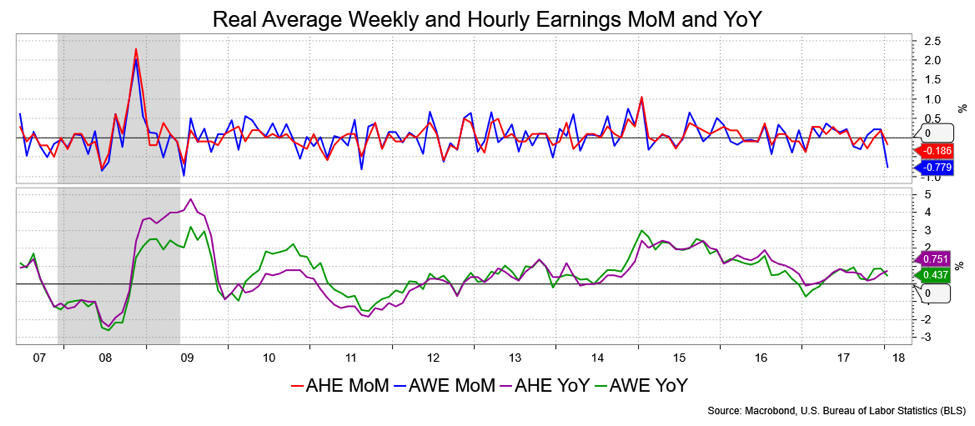
The chart below looks at REAL wage gains post the CPI report, YoY and MoM. This doesn’t portray a narrative of intensifying-wage pressures, with which I expect the inflation/stagnation story to give way to something rather more benign. Why isn’t this getting more attention? Because it doesn’t fit the price action and the price action needs a narrative.
The Fed has to be OK both with the bond market’s price action and its own forecast of where rates are going. Surely, the air being let out of the equity market satisfies some concerns about the impact of low rates on risk taking. That will keep them on the current path for a third and maybe, my bias, a fourth hike this year. The Fed has some solid numbers under it—jobs and not falling inflation—so it’s got to be anxious over the impact of the tax plan and related stimuli to keep them balancing out the profligacy of the surging deficit. I bet you never heard a Fed official bowing before the crown of “the King of Debt?”
The next chart comes at the request of a Boston portfolio manager in a discussion over “normal” rates. What you see is, simply, 10s minus CPI with the mean between 2000 and 2008. Currently, that spread is about 80 bps (not reflected on the chart below). The mean spread since 2008 is 86 bps and 132 bps since 2000. I’m not sure we’ll get back to that 2000 level, but over 80 bps is getting close to a “value” level, I submit.
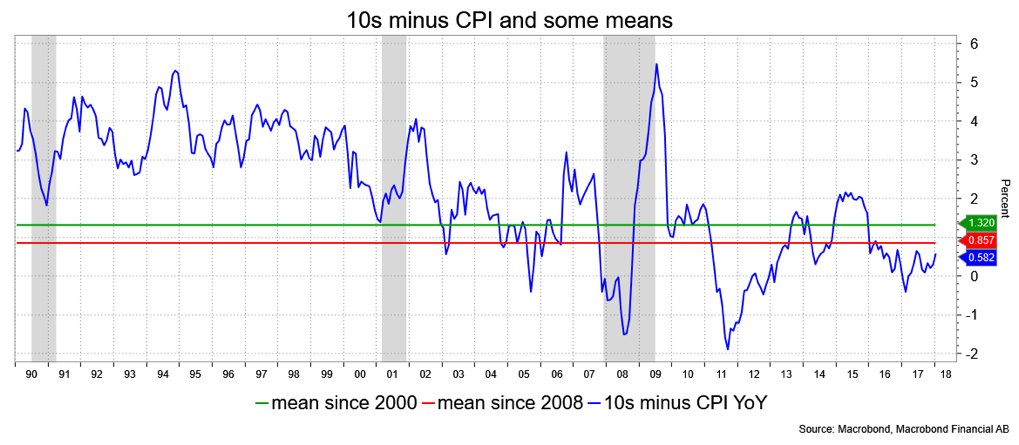
If you prefer PCE, the mean spread since 2008 is 106 bps vs. 120 bps now. The core figures for CPI and PCE also suggest the spread is in the average zone over the last 10 years. So too is comparing the S&P 500 Dividend Yield of 1.89 percent vs.10s. The mean spread is 89 bps since 2006; now it’s about 100 bps. At least it ought to make you think.
David Ader is Chief Macro Strategist for Informa Financial Intelligence.