
We recently saw a “death cross” in the 200-day and 50-day moving averages. But despite the foreboding name, turbulence may be minimal.
A death cross occurs when a long-term moving average crosses above a shorter one—the 200-day and 50-day are the most popular moving averages. Imagine that when the former moves under the latter you get an "X" pattern; hence, the term cross.
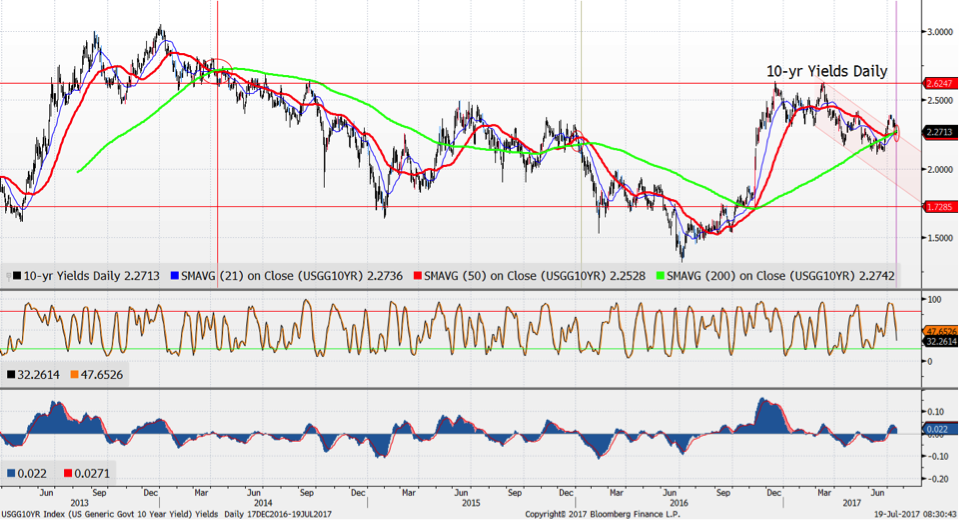
The chart below shows 10-year yields with the 200-day moving average in green and the 50 in red, with vertical lines showing when it’s happened in recent years. It’s not a common occurrence; we had one in April 2014 and another in January 2016. A deep rally ensued. I very much doubt the most recent occurrence will lead to the 75–100 basis point rallies that took place the last time we saw such a thing. The cross now seems less steep and more a confluence of the pair. I think we’re probably closer to the behavior of late 2015, when the confluence resulted in a two-month range as opposed to a rally. (Though it did, ultimately, conclude in a rally.)
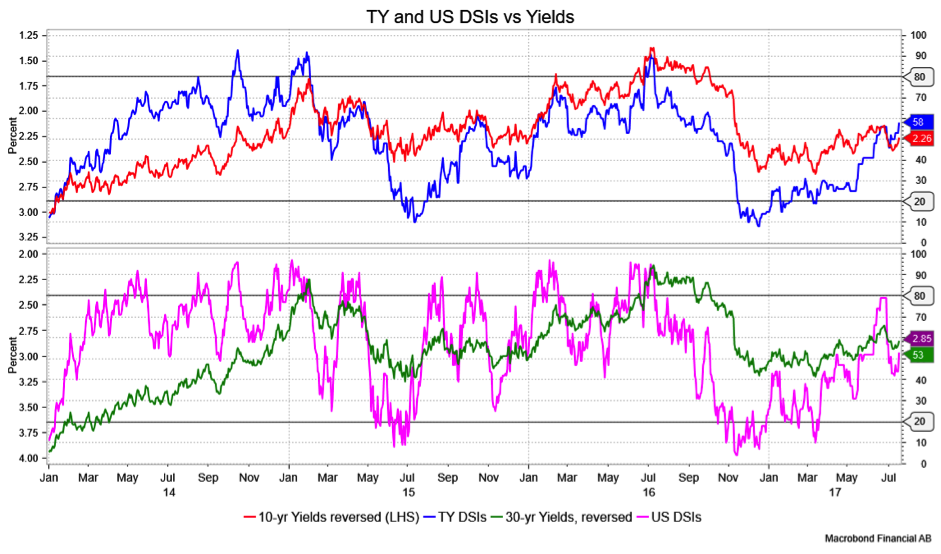
One thing that strikes me now versus those periods is that sentiment, as measured by Daily Sentiment Indexes, had been coming off of bearish extremes in the preceding few months, rising to overbought levels. In the last few months, we’ve seen a much more gradual rise to work off oversold conditions (from late last year), suggesting sentiment, at least, is rather less desperately shifting.
David Ader is chief macro strategist for Informa Financial Intelligence.