
When the going gets tough, the tough turn to defensive sectors. In the first four months of 2020, the traditionally defensive Health Care and Consumer Staples sectors of the S&P 500 Index lost limited ground. Health Care Select Sector SPDR (XLV) fell only 1.1% year-to-date through April 24, while Consumer Staples Select Sector SPDR (XLP) declined just 6.3%. Both easily outpaced the 12% loss for SPDR S&P 500 ETF (SPY). Fans of stock-specific diversification also found solace in the defensive sectors. Invesco S&P 500 Equal Weight Health Care ETF (RYH) and Invesco S&P 500 Equal Weight Consumer Staples ETF (RHS) lost just 4% and 7.7%, respectively, much less than 20% for the Invesco S&P 500 Equal Weight ETF (RSP). In 2020, mega-cap companies with strong balance sheets and stable dividends held up best at the sector and broader index level during times of increased market volatility and uncertainty. The S&P 500 Consumer Staples and Health Care sectors sport 3% and 1.8% dividend yields, respectively.
Chart 1: Year-to-date Performance of Consumer Staples and Health Care ETFs (%)
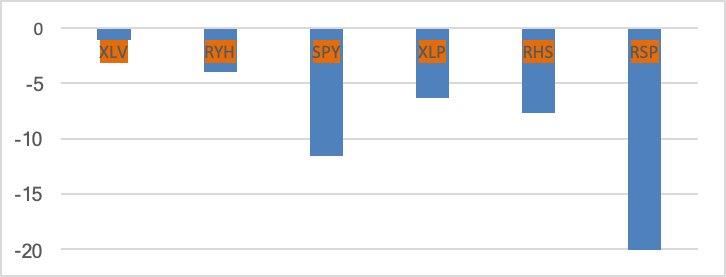
First Bridge Data, a CFRA company. As of April 24, 2020
CFRA advises rotating—not retreating—in May. In 2020, the typically seasonal volatility for the S&P 500 Index came early as the broader index fell sharply toward the end of the first quarter, before partially recovering in April. Indeed, as Sam Stovall, Chief Investment Strategist at CFRA, explains, some sectors historically have had their day in the summertime sun, while other sectors usually skate along smoothly in winter. Since 1990, which is as far back as S&P Dow Jones Indices has sector-level data, the overall cap-weighted S&P recorded a gain of only 1.8% from May to October. Cyclical sectors such as Energy and Materials declined in value on average, but the S&P 500 Consumer Staples and Health Care sectors posted price increases of 4.4% and 4.9%, respectively. Conversely, when the S&P 500 enjoys its strongest six-month return in the November through April period of 6.4%, the cyclical sectors beat the defensive ones. Indeed, since 1990, above-average returns in the seasonally strong period came from the Consumer Discretionary, Industrials, Information Technology, and Materials sectors, which consistently outperformed the broader benchmark.
Chart 2: S&P 500 Equal & Cap-Weighted Seasonal Returns
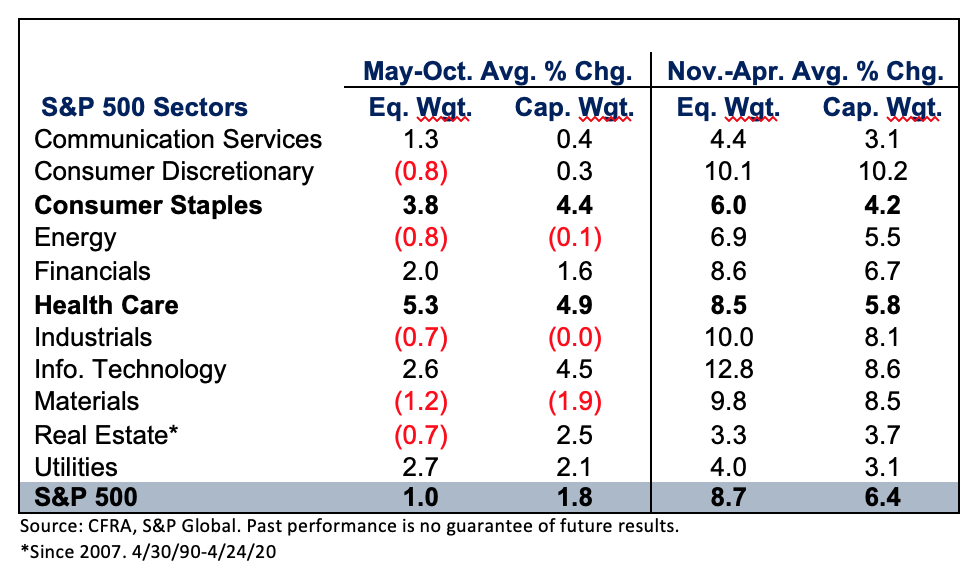
The performance of defensive sectors during May through October has historically been similarly impressive using the equal weighted sectors of the S&P 500 Index. Health Care (5.3%) and Consumer Staples (3.8%) outperformed the 1% gain for the broader S&P 500 Equal Weight index during the seasonally weak period for cyclical sectors but lagged during November through April. Looking forward, CFRA recommends an overweight stance to both the Consumer Staples and Health Care sectors.
An equally weighted approach is less addicted to pharmaceuticals. The equal-weighted and the cap-weighted sectors own the same S&P 500 constituents but perform differently because of how much exposure to each name is found inside. At the stock level, investors in XLV own more Johnson & Johnson and less Laboratory Corporation of America than RYH as JNJ had a recent market capitalization of over $400 billion, more than 20 times that of LH.
JNJ is joined by Bristol Myers Squib, Eli Lilly, Merck, and Pfizer in the top-10 of XLV, making the ETF highly dependent on the pharmaceutical industry (33% of assets). XLV also provides diversification to other industries, such as Health Care Equipment & Supplies (24%) and Health Care Providers & Services (19%).
Yet, RYH had more exposure to Health Care Equipment & Supplies (32% of assets) and Health Care Providers & Services (24%) than Pharmaceuticals (16%) as there are more health care constituents from these industries in the S&P 500 index. Companies such as Baxter International and ResMed have not swelled to the degree of JNJ and peers.
Chart 3: S&P 500 Health Care Equal & Cap-Weighted Exposure (% of assets)
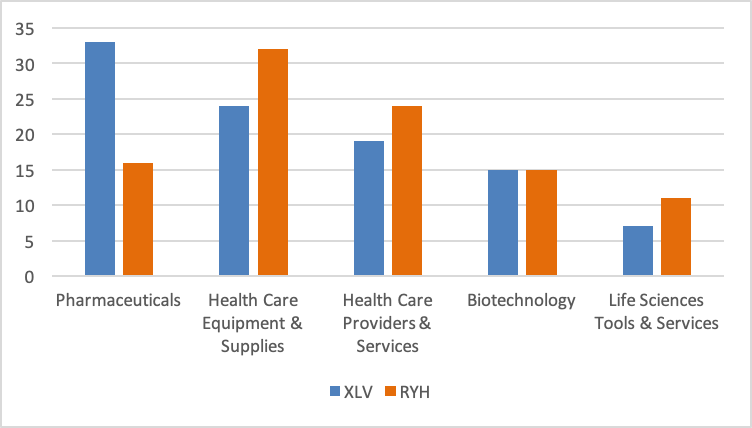
First Bridge Data, a CFRA company. As of April 24, 2020
Is a cap-weighted approach to consumer staples more diversified? Industry differences between the cap-weighted XLP and its equally weighted consumer staples ETF peer RHS are similarly stark as we found in the Health Care sector. While XLP is concentrated at the stock level, with 10%+ positions in attractively valued Procter & Gamble, PepsiCo, and Walmart, the fund is surprisingly more diversified than RHS at the industry level.
For XLP, household products (26% of assets) was the largest industry, followed by beverages (25%) and food & staples retailing (20%). All three industries were smaller for RHS, as the equally weighted ETF had a whopping 40% of assets in food products. Conagra Brands and J.M. Smucker are examples of moderately sized food product companies with relatively large stakes in the Invesco sector fund.
Chart 4: S&P 500 Consumer Staples Equal & Cap-Weighted Exposure (% of assets)
First Bridge Data, a CFRA company. As of April 21, 2020. 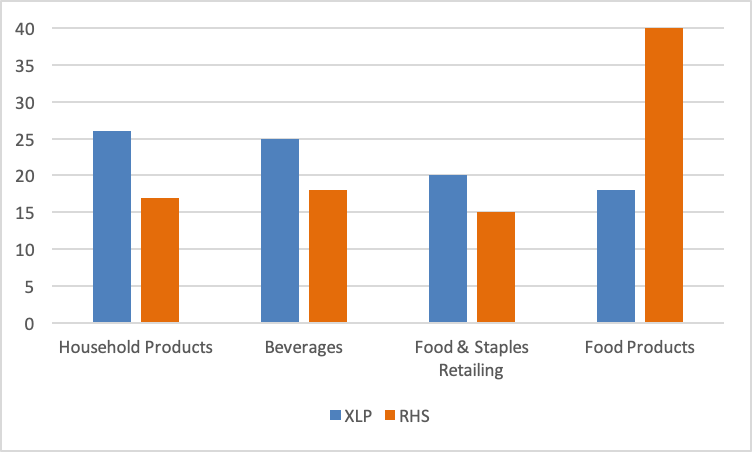
CFRA has a more favorable forward-looking view on five-star rated XLV and XLP compared to RYH and RHS from a cost, reward, and risk perspective based on our proprietary holdings-based and fund-specific analysis. While Invesco ETFs have higher expense ratios than the Sector SPDRs, the holdings-level differences are a more important area of focus, according to our research. Our star ratings for U.S. sector ETFs do not solely rely on past performance, but incorporate an analysis of costs, risks, and the likely future prospects of the underlying holdings.
Conclusion
The consumer staples and health care sectors have outperformed the broader S&P 500 in 2020, whether looking to the cap-weighted or equally weighted S&P 500 Index. Yet, historically the best six-month period for these sectors is only set to begin, according to CFRA’s analysis. Before choosing an ETF for these defensive sectors, it pays to look inside as the stock- and industry-level differences between them is significant. It is no wonder that the historical performance records are much wider than the ETFs’ expense ratios.
To learn more about CFRA’s ETF ratings approach and see a video on how to utilize our reports, visit https://go.cfraresearch.com/ETF_MutualFund_Rating.
Through May 31, 2020 CFRA is extending an offer to North America-based individual investors for complimentary 90-day access to The Outlook, our flagship online weekly newsletter, to help investors navigate the impact of Covid-19 on the financial markets. Financial advisors can have their clients request access here: https://advisor.marketscope.com/#/Outlook90.
Todd Rosenbluth is the director of ETF and mutual fund research at CFRA. Learn more about CFRA's ETF research here.