
It’s often said that consumers drive the U.S. economy. And for good reason. Consumer spending makes up 70% of domestic GDP, some $13.28 trillion in 2019. The demand for goods and services—and for the companies that provide them—isn’t constant or universal. The uptake for some items vacillates with the economic cycle, while others enjoy more constant demand.
The contrast is readily apparent when the trajectories of consumer stocks are compared. Noncyclical issues are represented by the Consumer Staples Select Sector SPDR Fund (NYSE Arca: XLP), an exchange traded portfolio populated with the likes of Procter & Gamble Co. (NYSE: PG), Coca-Cola Co. (NYSE: KO) and Kimberly-Clark Corp. (NYSE: KMB) among others. The goods made by these companies are must-haves: toothpaste, coffee and toilet paper, for example. On the flip side are the companies dominating the Consumer Discretionary Select Sector SPDR Fund (NYSE Arca: XLY), including General Motors Co. (NYSE: GM), McDonald’s Corp. (NYSE: MCD) and Booking Holdings Inc. (Nasdaq: BKNG). A new car, a Big Mac and a resort hotel reservation are things we’d all want (well, maybe) if we had extra money in our pockets.
Since their 1998 launch, the ETFs’ price paths have often taken disparate twists and turns. They’re captured in the course traced by the ratio charted below. Consumer sentiment is gauged by dividing XLY’s price by XLP’s. Confidence builds as the ratio increases—that is, when the discretionary ETF gains against the staples fund. A shrinking ratio reflects fear of an impending economic downturn. Reversals in the ratio’s trend are usually predictive of actual changes in the business cycle.
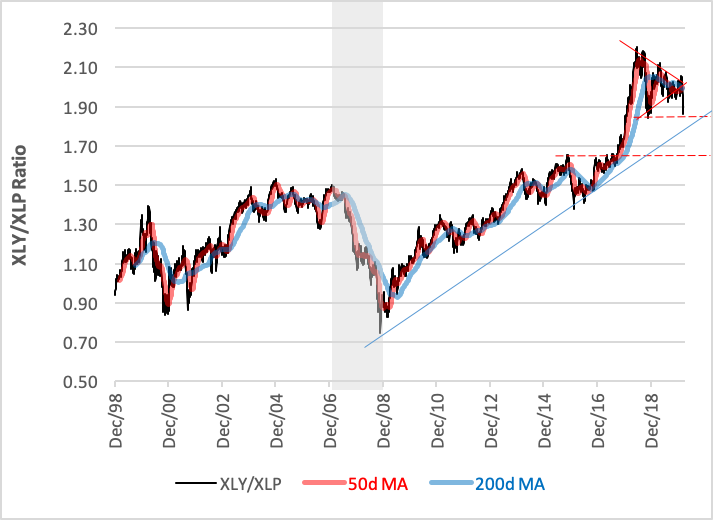
The chart’s most salient feature is the dramatic and, at times, unrelenting climb of the XLY/XLP ratio in the decade following the Great Recession. From trough to peak, discretionary stocks rose at nearly five times the pace of staples, propelling the XLY/XLP ratio from 0.97 to 2.20 by June 2018. Since then, however, the ratio’s been subject to a great deal more volatility as it struggled to find its footing.
And now? Just last week, the ratio broke out of its congestion area and seems headed south to test a late-2018 support area. If that’s violated, retracement to a mid-2017 resistance plateau could ensue. In a nutshell, the ratio’s telling us, more definitively than ever, that consumer confidence has—or soon will be—shaken severely.
In the weeks to come, that blue trend line is the thing to watch. If breached to the downside, there could be dramatic economic and political consequences.
Keep your powder dry.