By Ryan Detrick
October is known for volatility, and we’ve sure seen it so far. In fact, by many measures, October is poised to be one of the worst months in years. The S&P 500 Index has had two separate six-day losing streaks this month for the first time in history. That pretty much sums it up.
Here are five takeaways from October’s action so far:
The bad news.
- The S&P 500 is down 8.8 percent month to date, which would make this the worst month since February 2009 and the worst October since 2008 if it finishes the month at its current level.
- Six days out of 18 (33 percent) have closed at least 1 percent higher or lower for the first time since 1963, which comes on the heels of not a single 1 percent change during the entire third quarter of 2018.
- The S&P 500 has been down 14 days so far in October, the most for any month since May 2012. Also, 78 percent of the days this month have closed in the red (14 of 18), the worst for any month since 82 percent of days in April 1970 closed down.
Now, for some good news.
- Since 1950, there have been seven other years when the S&P 500 was positive year-to-date at the end of September, but fell negative year to date at some point during the month of October. The final two months of those years were higher six times and up 4.1 percent on average.
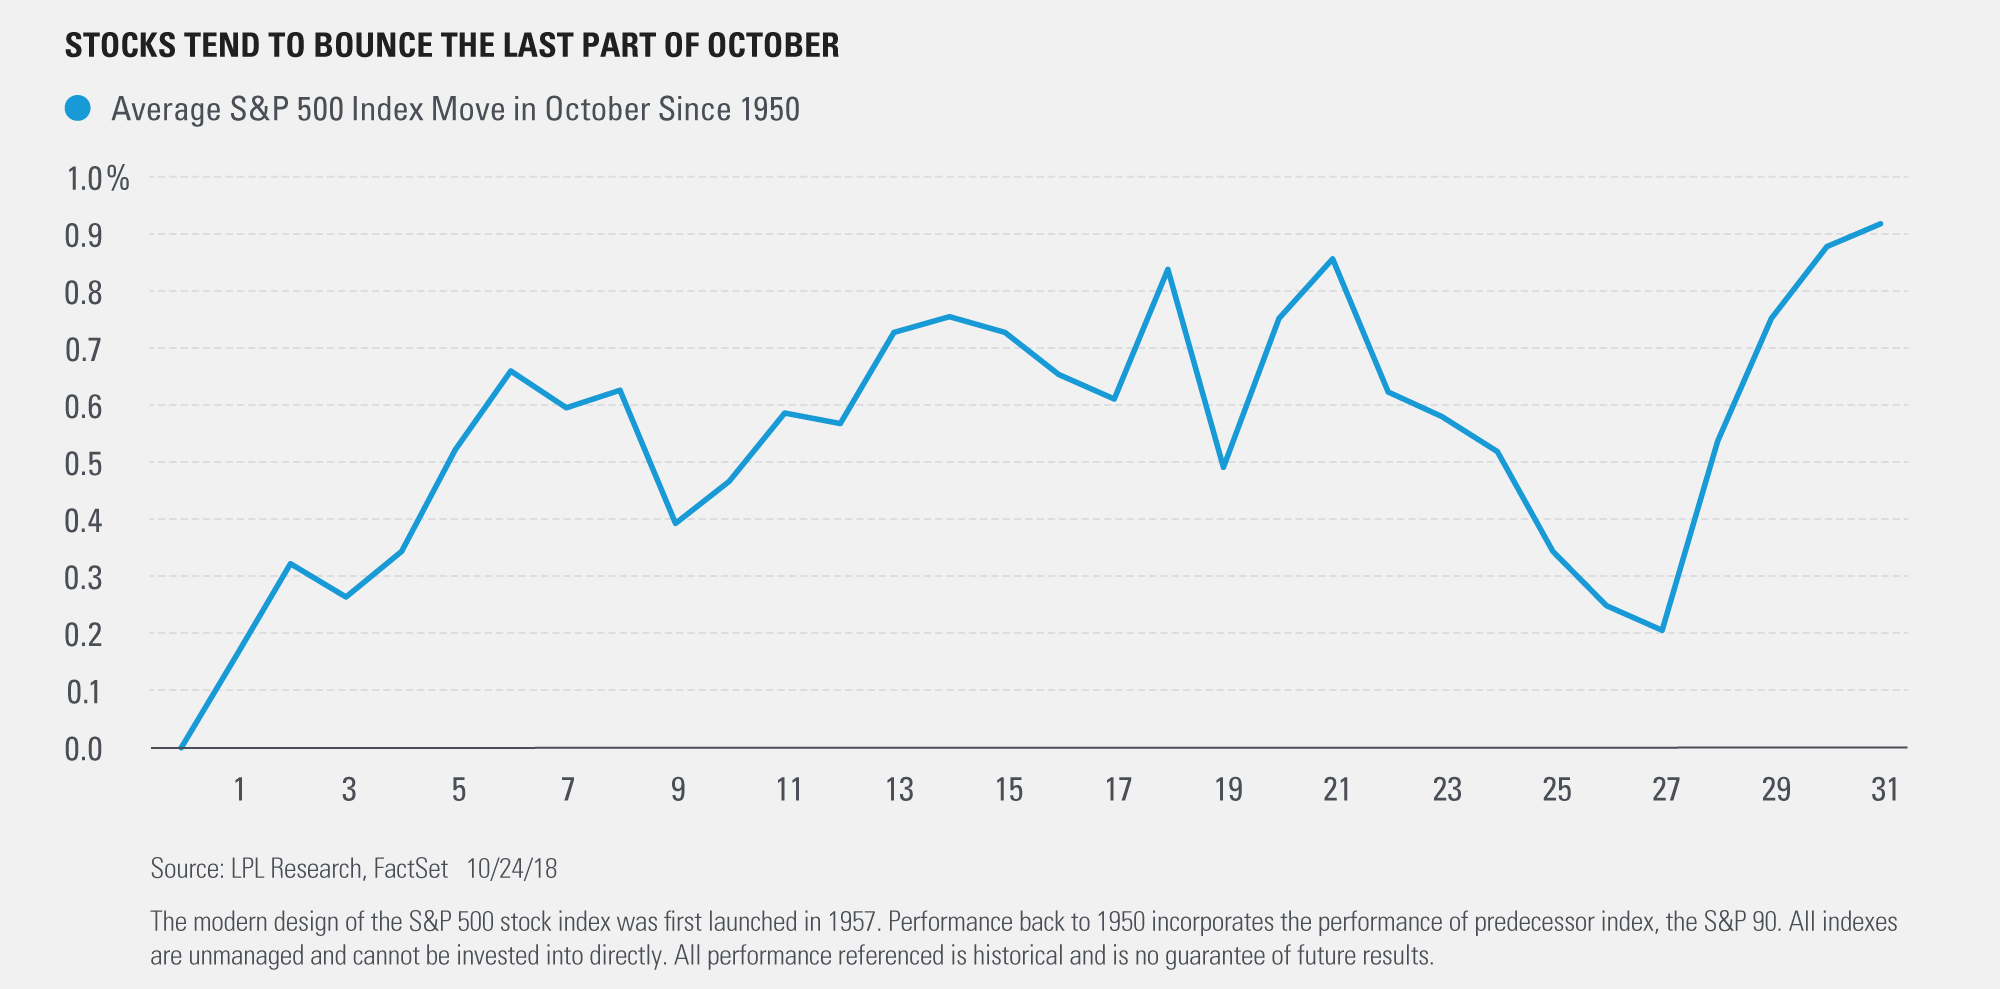
- Historically, the last few days of October have been some of the strongest of the year. With markets looking extremely oversold, the stage could be set for a rally.

For more on our thoughts on this market sell-off, please read this recent blog post.
Ryan Detrick is Senior Market Strategist for LPL Financial
0 comments
Hide comments


