Winter Bites. Treasury yields fluctuated in a fairly narrow range last week. For example, the ten-year T-note yield intraday range was ten basis points. The level was 2.76% on Friday morning. Since July, a roughly 2.45% to 3.05% trading range has been in place.
The main points of interest from last week were:
-
Severe winter weather bit the economic data. The severe winter weather has depressed the economic data and that makes it tougher to get a read on the underlying trend. January economic data released last week fell well below the consensus. For example, the Philadelphia Fed manufacturing index declined 15.7 points to a level of negative 6.3, the worst level in a year (back when the fiscal cliff and sequester affected economic decisions). The Empire State index fell sharply as well. Housing activity, so dependent on the weather, was crushed by the deep cold and big storms. The home builder sentiment index fell by a record 10 points and housing starts were off by over 16%. Inflation data were about the only numbers that came in around consensus. Pushed by rising housing inflation, the headline Consumer Price Index was 1.6% y/y last month versus 1% in October.
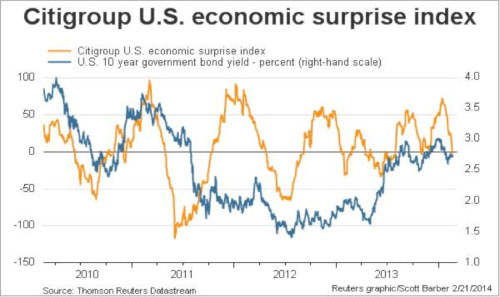
We can see in Chart 1 the sharp rollover in the economic surprise index. It is now below zero, telling us that the weight of economic surprises has shifted to negative. In the chart we also can see that, over the past year, the rollover in the index has been generally correlated with the decline in the ten-year T-note yield. There has been, however, a tendency for the T-note yield to change trend direction in advance of the surprise index. Given that the index is a lagging moving average, it serves as more a confirming indicator that a leading indicator.
By the way, with this index (and others like it) of greater interest in times of a data-dependent Fed, just what is it? The index is constructed by Citigroup using a three-month moving average of the weighted historical standard deviation of actual economic indicator results versus Bloomberg consensus forecasts. The weight for each indicator is based on that indicator’s ability to move the currency market. The series is time-weighted as well, with the most recent results of more importance. The index construction is not hard to understand which makes it easier to consult than some obscure method.Notice that most recently the ten-year T-note yield increased while the surprise index moved down. This behavior is explained by the 1) relaxing of the emerging markets-caused flight to quality, 2) Fed message that it will not stray from the tapering path despite weaker U.S. data and emerging markets troubles, 3) weaker data that is very weather-affected and may rebound in the spring, 4) imperfect correlation (and besides, correlation does not imply causation).
Chart 1: The Economic Surprise Index Rolled Into Negative Territory
-
The FOMC will stick to its plan. The minutes of the January FOMC meeting provided no real surprises. The Quantitative Easing (QE) taper is underway, and it will be tough to stop it. The Fed will ride out quirky weather-related weakness in the data. It looks like the Fed eventually will follow the lead of the Bank of England with a scrapping of the unemployment rate threshold for a broader set of indicators.
-
Overseas developments included expanded political protests. The Ukraine, Venezuela, and Thailand experienced more political unrest. While the unrest has not been enough to scare overnight markets, it has been carefully followed. China’s central bank withdrew liquidity from its money market. That was a “boo-hiss” for overnight markets. But Japan’s central bank expanded two lending programs and that was a “yay” for overnight markets. Markets expect a further ease of Japan’s monetary policy this summer.
On the data front, purchasing manager surveys from China and the euro area were a bit weaker than expected. Inflation data in the euro area was softer than expected.
At the G-20 meeting, advanced-economy monetary policy makers were under pressure from emerging markets officials to just please pay some attention to their troubles.
This Week in Bondland. Treasury will auction two-, three-, and seven-year fixed coupon notes, a two-year floater, and the usual T-bills. On the data front, be prepared for some more ugly reports thanks to Old Man Winter. Q4 GDP should be revised down from the first estimate of a 3.2% annual pace to a mediocre 2% to 2.5%. A few housing activity reports will be out and we suspect they will look a bit sad. Orders for durable goods and consumer confidence data will get into the limelight as well.
There will be a slew of FOMC members to speak this week, by our count, ten. They will provide opinions across the entire monetary policy spectrum. If you were to pay sporadic attention to the Fed speaker headlines you might be temporarily startled, say, if it was a policy hawk sound bite in favor of a rate hike right away. Or maybe there would be a policy dove sound bite in favor of no rate hike until 2016. Fed Chair Yellen will reprise her two-week-old testimony in an appearance before the Senate Banking Committee. You either pay attention to all of the Fed speaker headlines, or you just let the headlines fly by.
Calvert Investment Management (CIM) Outlook. We expect the economy to experience reduced drag from restrictive fiscal policy during an election year. The economy is in a sub-par economic expansion and not yet fully recovered from the severe financial crisis. We expect the economy to tend to post sub-trend growth rates with low inflation and an improving, but soft, labor market. For full-year 2014, however, there is a fair chance the rate of GDP growth could approach the 50-year average of 3.1%. Measures of economic slack, however, should remain elevated. The output gap, for example, could take at least two years to close under the FOMC’s generally optimistic forecast.
At the Janet Yellen Fed, monetary policy will continue on the same general course set under Ben Bernanke. Following the lead of the Bank of England, the FOMC appears to be heading toward a change in how it communicates the forward guidance. Various labor market indicators[i] are of primary interest to policymakers, not just the unemployment rated. There are two clear policy-voting hawks on the FOMC in 2014 (Plosser and Fisher) versus one last year. As a result, we could on occasion see two dissenting votes on FOMC decisions. The Fed’s December decision to taper, however, seems to have tamed the hawks for a while. We might see a policy dove dissent, as occurred with the December FOMC decision, if growth falters but tapering continues.
Given that economic growth is at some risk of drag from federal fiscal restraint and volatility in international equity and credit markets, and with the economy experiencing notable excess capacity, we expect tapering of Treasury and MBS purchases to occur at the currently prescribed pace of $10 billion per FOMC meeting in 2014.
The Fed will continue to signal to markets, through forward guidance, to expect a first hike in the policy target rate no earlier than mid-to-late 2015. The market will challenge this guidance from time to time, primarily by pushing up yields in the two- to five-year maturity area. It would take a financial crisis or convincing evidence of a recession and/or deflation threat for the Fed to pause the tapering of the QE, or engage in another form of easing.
We expect the benchmark ten-year T-note rate to fluctuate broadly around the 3% level for at least the first half of the year, mainly influenced by the trend in economic data surprises. The belly of the yield curve will tend to lead rallies and selloffs. Money markets rates will remain pinned near zero percent.
See our 2014 outlook roundtable discussion here: http://www.calvert.com/newsArticle.html?article=20896
[i] Indicators include various unemployment rates (e.g., U-3 and U-6), payrolls gains or losses, hourly earnings, selected series from the JOLTS survey, and the labor force participation rate.


