Sponsored by Gurtin Municipal Bond Management, a PIMCO company 
A municipal bond’s embedded call option allows the issuer of the bond to “call” (i.e., pay back) the debt at a date prior to the bond’s final maturity, which allows the issuer to reduce the cost of financing when rates decline. To compensate investors, bonds with embedded call options, referred to as callable bonds, are typically offered at higher yields than non-callable bonds. Callable bonds represent the majority of the municipal bond market, at 84.46%, or $6.13 trillion, of total issuance over the past 20 years. [1]
Municipal market convention is to quote the yield spread on a maturity-matched basis to the municipal market data (MMD) curve, which does not consider the variety of coupons and embedded call options that many of these bonds possess. This can lead to misunderstanding of a bond’s value, presenting an opportunity for managers with the ability to calculate benchmark yields for bonds with any possible combinations of coupon and call structures through the use of an interest rate and pricing model.
The MMD Yield Curve
The MMD yield curve is the most widely referenced yield curve in the municipal bond market. For investors familiar with the Treasury curve, which quotes the yield to maturity (YTM) on non-callable Treasury bonds, the conventions of the MMD curve might be surprising.
The benchmark bonds along the MMD curve reflect the standard for newly issued bonds in the municipal market, with the curve assuming:[2]
- 5% coupon[3]
- Maturities within 10 years are non-callable
- Maturities greater than 10 years have a 10-year lockout period (i.e., are not callable for the first 10 years)
- YTM is used for non-callable structures, while yield to call (YTC) is used for callable structures
Given these assumptions, the MMD curve acts as an appropriate benchmark for determining how cheap or expensive a newly issued 5% coupon callable municipal bond or non-callable bond under 10 years to maturity is, relative to the broader market. However, most bonds in the secondary market do not match the call and coupon assumptions of the MMD curve, which has led to the development of a municipal market convention of quoting yield spreads on a maturity-matched basis.
Municipal Market Conventions
Let’s take, for example, a bond with 15 years to maturity and a seven-year lockout period (abbreviated as 15NC7). Given the assumptions behind the MMD curve, this bond has no direct comparison point on the MMD curve. To adjust for this, a convention has developed in the municipal market in which the quoted yield spread matches the maturity of the bond to the maturity on the MMD curve, regardless of the bond’s differences in years to call or coupon relative to the MMD curve’s assumptions.
In the case of the 15NC7, the spread to MMD would be calculated by comparing the yield of this bond with the yield of the 15-year maturity point on MMD, whose 15NC10 structure is very different than that of a 15NC7, leaving the MMD spread difficult to interpret as a measure of relative value in the 15NC7 bond.
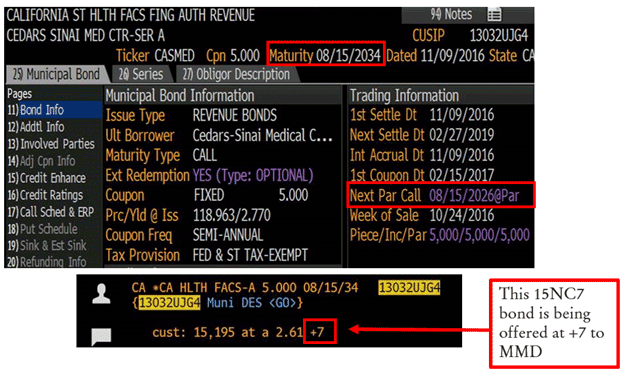
Figure 1. A Non-Standard Municipal Bond Structure[4]

For a real-world example, Figure 1 shows a bond with a final maturity of August 2034 and the next par call on August 2026, giving it a 15-year final maturity and a seven-year lockout. The spread on the 15NC7 is quoted as the difference between its YTC of 2.61% and the 15NC10 MMD yield of 2.54%. This results in a 7-basis point (bps) spread to MMD for this bond. At first glance, this suggests little value in the 15NC7 relative to market yields, but this approach is obviously lacking in revealing the true value of a bond relative to the market, since it is not being compared to the same structure. Is there a better way?
The Value of a Quantitative Approach
Starting from daily measures of the levels and volatilities of MMD yields, our quantitative research team has developed an interest rate and pricing model to calculate the MMD-implied yields on bonds of all call and coupon combinations. Rather than relying on the MMD curve alone, we instead compare the YTC on bonds in the market to the market-implied YTC for a bond of the same characteristics. The resulting yield spread provides a consistent measure of the value of the bond.
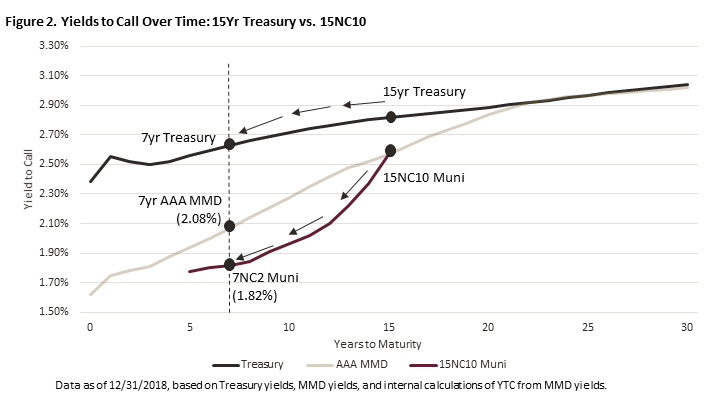
The importance of a calculation like this is highlighted if we consider how we value bonds in the secondary market for both a Treasury bond and a 5% coupon AAA callable municipal bond. Valuation in the Treasury market is straightforward because Treasury bonds do not contain optionality; over time, one need only know how the years to maturity on the bond has changed. Assuming we start from a 15-year Treasury bond, eight years from now this bond would have seven years to maturity and its yield can be determined directly from the 7-year point on the Treasury curve. The same is true for a 15NC10 AAA municipal bond only in the primary market.
According to MMD conventions, we know that the 15-year point on the MMD curve gives the YTC for a bond with 10 years to call, exactly matching this newly issued bond. However, unlike a 15-year Treasury, the 15NC10 municipal bond does not roll down along the benchmark curve over time. Under the same time progression as is outlined above for the Treasury bond, after eight years this municipal bond would be considered a 7NC2, since both its years until maturity and years to call have each decreased by eight years.
Rather than determine the yield on this bond from the seven-year point on MMD (as in the case of the market spread convention), we use our interest rate and pricing model to calculate the internal YTC on a 7NC2 AAA municipal benchmark structure. Given the difference between the seven-year MMD yield and our calculated MMD-implied yield for the generic 7NC2 structure, we would determine a 26 bps lower benchmark YTC for this structure, as illustrated in Figure 2.[5]

Positioning Municipal Bond Investors to Benefit from Opportunities in Callable Bonds
Working with a municipal bond manager with a strong quantitative research department and expertise in sourcing and valuing callable bonds can provide investors with the resources they need to take advantage of municipal bond market inefficiencies in the callable bond space with the aim of capturing additional yield on undervalued bonds.
For more information on Gurtin’s proprietary interest rate and pricing model that enables our traders to take advantage of what we believe are mispriced offerings and capture additional value when purchasing callable municipal bonds, please contact our team at [email protected].
To learn more about how we find value in callable bonds, including details about a phenomenon known as “yield kick,” check out our white paper: Callable Bonds: Finding Value and Quantifying Risk
And be sure to watch our team discuss callable municipal bonds in our webinar: Callable Municipal Bonds Webinar
See related Gurtin disclosures.
David Conway is a Senior Vice President, Investment Research & Strategy, Gurtin Municipal Bond Management.
Jacob Arentzoff is an associate, Investment Research & Strategy, Gurtin Municipal Bond Management
[1] SIFMA U.S. Municipal Bond Issuance Data, published January 3, 2019. 20-year period reflects January 1, 1999-December 31, 2018; issuance data is from S&P, reflective of the period December 31, 2015-December 31, 2018.
[2] https://www.tm3.com/mmdrewrite/mmd/g_14949_w.faces?pgId=14949
[3] Historically, there have been rare times when a 5.25% or 5.50% coupon were assumed.


