You’ve noticed the recent drop in interest rates, haven’t you? On Friday, August 15, the 20-year Treasury yield fell to 2.86 percent, a level not visited since June 2013. Wha’ hoppened? I mean, weren’t all the pundits calling for higher rates?
Yields, in fact, may very soon move higher. Not by much, perhaps, and maybe for just a short time. T-bonds looked a little toppy—not quite overbought, but certainly headed that way—going into the weekend. More about that in a minute.
Plainly, the bond market’s paying more attention to geopolitical events—heightened tensions in Ukraine, military intervention in Iraq and violence in Gaza—than to Fed tapering and improving economic data. Safe haven demand for Treasurys has driven prices higher and, consequently, put downward pressure on rates.
Factor in, too, a seemingly benign inflation outlook: in the past couple of weeks, the 10-year breakeven inflation rate slumped ten basis points to 2.18 percent.
So why should a bounce in yields be expected now?
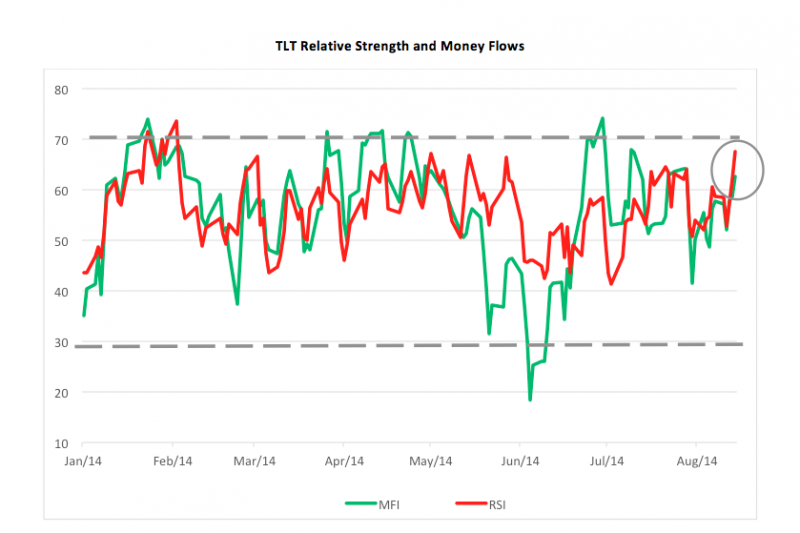
Go back to that word “overbought.” Bond prices vacillate like any other asset. Within secular trends there are always counter movements reflecting the ebb and flow of risk capital. Take a look at the chart below. It depicts two key indicators—the Relative Strength Index (RSI) and the Money Flow Index (MFI)—tracking the iShares 20+ Year Treasury Bond ETF (TLT).

Both RSI and MFI are oscillators, that is, they’re indicators of overbought or oversold conditions. A security is likely overbought when the indicators are at or above the 70 level and oversold at or below the 30 level. RSI measures the security’s price strength relative to its recent history while MFI meters the security’s volume-weighted momentum. Most of the time, both indicators move together but sometimes they diverge for a very short period.
If you look at TLT’s performance since the beginning of the year, you’ll note that, for the most part, RSI topped out before reaching 70 (a double top in late January/early February did, however, set up a swift and considerable decline in TLT’s price). Both RSI and MFI are fast approaching the 70, or overbought, level. What’s significant now is that RSI is ahead of MFI, the very same condition that preceded the February break in TLT’s price.
Bottom line? There’ll likely be a buying opportunity very soon for investors who believe that yields are destined to move lower still. More immediately, it’s a signal that short-term bond traders may take some of their money off the table.
Brad Zigler pens Wealthmanagement.com's Alternative Insights newsletter. Formerly, he headed up marketing and research for the Pacific Exchange's (now NYSE Arca) option market and the iShares complex of exchange traded funds.


