
Feeling whipsawed?
Well, if you tried to use the oil market tactically as an inflation hedge, you might very well be reeling from the market’s recent price action.
Your intentions might have been noble. After all, oil’s influence on inflation is significant. In his recent testimony before the Senate Banking Committee, Federal Reserve Chair Jerome Powell offered this rule of thumb: Every $10 hike in the barrel price of crude raises inflation by 0.2%.
Crude oil had been steadily rising off a 2020 COVID-19-induced slump, feeding latent inflation concerns among investors and their advisors alike, only to break wildly to the upside on news of the Russian invasion of Ukraine.
You’d think this would be good news for buyers of oil ETF hedges. And maybe it was. Then again, maybe not. After West Texas Intermediate crude hit an intraday high of $130 a barrel a week ago, prices quickly slumped to preinvasion levels under $100. That’s still well above their pandemic lows, but how many of us bought the low?
And how many of us picked the right hedge in the first place? Or at the right time? After all, there’s more than one way to use the oil market to hedge inflation.
First of all, there’s oil itself. You can get exposure to front-month WTI futures prices through the United States Oil Fund (USO). Front month you ask? That’s simply the futures contract with the nearest delivery date, the one most sensitive to current demand.
If you want continuing exposure to oil—as you would in a hedge lasting more than one month—you have to allow for the pricing dynamics of the futures market. For USO to maintain its front-month exposure, it must continually “roll” its futures holdings as its contracts approach expiration. Simply put, the fund must sell the expiring contracts, using the proceeds to buy the next delivery month. When oil is in short supply, the futures curve favors USO buyers. Front-month contracts are typically bid up, reflecting demand for immediate delivery, while back-month futures are priced at a discount. On a roll in a tight market, there’s a premium that can be earned as the high-priced contract is traded for the discounted futures, i.e., “selling high, buying low.”
The opposite holds true when a “contango” exists—that is, when oil’s in glut as was the case in the depths of the pandemic—and front-month futures are cheaper than distant deliveries. The market continuously wobbles between contango and its opposite (known as “backwardation” or “inversion”). In the past five years, for example, the WTI market’s been inverted 53% of the time, encouraging long oil hedges. The rest of the time, such a hedge was costly.
You could avoid the vagaries of the futures market by using oil sector ETFs instead. Among the equity funds representing integrated oil operators, the $6 billion SPDR S&P Oil & Gas Exploration & Production ETF (XOP) is the largest. XOP tracks an equal-weighted index of companies involved in the discovery of new oil and gas deposits such as Chevron Corp., Occidental Petroleum Corp. and Marathon Oil Corp.
Then there’s the oil services sector proxied by the VanEck Oil Services ETF (OIH), a cap-weighted compendium of large energy equipment and service purveyors. OIH’s portfolio includes Halliburton Co., Schlumberger NV and 23 others.
Finally, the downstream segment of the oil market, represented by the VanEck Oil Refiners ETF (CRAK), could be utilized as a potential hedge. Named for the so-called “crack spread”—the price differential between input crude oil’s cost and the sale proceeds of refined output products—CRAK’s 25 constituents include outfits such as Phillips 66, Valero Energy Corp. and Marathon Petroleum Corp., among others.
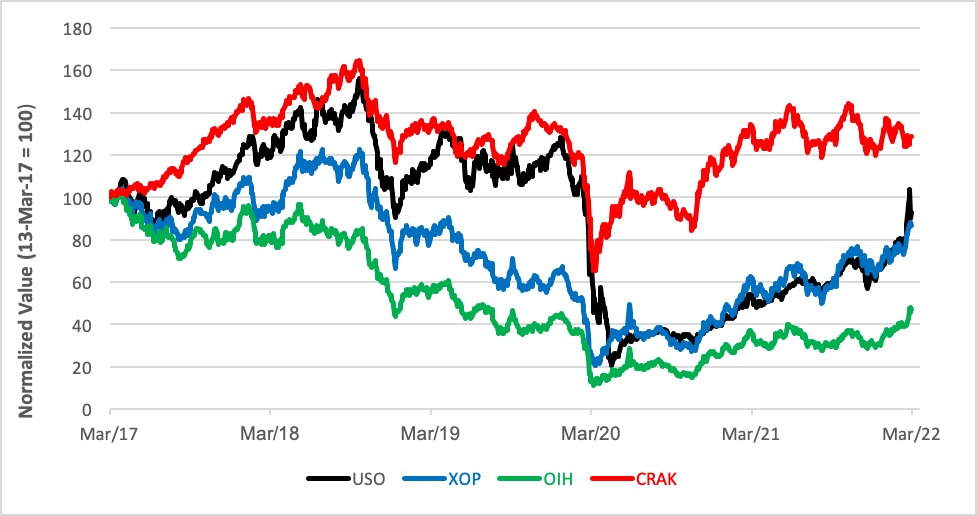
Amid all of the volatility in the past five years, it’s telling that only one of these oil exposures is now above water. CRAK’s been growing at a compound annual growth rate of 5.8% with a very market-like volatility of 24.6%. Each of the other oil ETFs—even crude’s avatar, USO—have racked up negative average annual returns since 2017.
OIL ETFs’ Five-Year Track Record
At work here is that crack spread and its impact on refiners’ profits. Gross refining margins tend to be more stable than crude oil prices because refiners can throttle the production of outputs such as gasoline and fuel oils to meet demand. Consumers’ thirst for gasoline—and its price—tends to peak during the summer driving months, while competition for heating oil supplies tops out in winter. Refiners adjust their production mixes to meet this offsetting seasonality in order to keep their margins on an even keel.
All told, a hedger using CRAK is in for a smoother ride than a user of USO or the other oil sector ETFs. For more conservative portfolios, the smaller bumps and shallower potholes in CRAK’s price trajectory make hedge entry and exit timing less critical. And that makes it more likely that CRAK may be held in a portfolio precisely when it’s needed most.
Brad Zigler is WealthManagement's alternative investments editor. Previously, he was the head of marketing, research and education for the Pacific Exchange's (now NYSE Arca) option market and the iShares complex of exchange traded funds.


