
The S&P 500 Index is widely used to support smart-beta ETF investors seeking enhanced reward or reduced risk.
According to CFRA’s First Bridge ETF Database, there was $140 billion in assets spread across more than three dozen ETFs offering a non-market-cap-weighted slice of that widely referenced index. This S&P 500-based Swiss-army knife includes ETFs constructed based on fundamental metrics (such as balance sheet strength, dividend records and earnings growth), price movement (such as high beta, low volatility and momentum), and environmental, social and governance (ESG) metrics (both broad and targeted). In addition, there are ETFs owning all the stocks in the S&P 500 Index but instead of using a cap-weighted approach, the funds were either equally weighted or reverse weighted, meaning they own less Apple and more Alaska Air.
Smart beta is an industry term that includes a wide range of ETFs constructed differently from traditional market-cap-weighted ones. Despite the nickname, investors should not expect them all to outperform the broader market in all time periods. Rather, they need to understand the historical performance as well as what is driving future returns.
A higher-risk and more growth-oriented approach worked best over the past year. In the one-year period ended March 5, the cap-weighted SPDR S&P 500 ETF (SPY) rose 29%. However, 19 smart-beta ETFs that fish in the S&P 500 pond performed even better, led by an 82% gain for Invesco S&P 500 High Beta ETF (SPHB). This fund owns the 100 stocks in the parent index with the highest sensitivity to market movements and is reconstituted quarterly. Following the February rebalance, the fund was heavily weighted to Financials (28% of assets), Energy (21%) and Consumer Discretionary (17%) stocks, including Devon Energy and Lincoln National.
Chart 1: Leading Smart-Beta S&P 500-Based ETF Returns (%)
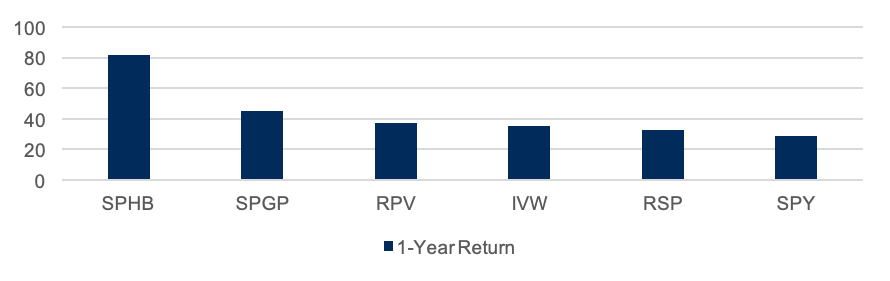
CFRA’s First Bridge ETF Database. As of March 5, 2021.
The second-best performer was Invesco S&P 500 GARP ETF (SPGP), which rose 45% in the past year. SPGP holds 75 companies that have favorable growth as well as strong quality and value composite scores based on factors such as earnings growth, financial leverage, and earnings-to-price ratio. The ETF is rebalanced annually, but currently Financials (29% of assets), such as Cigna, and Information Technology (19%), like Adobe, are well represented.
The more traditional growth ETF, iShares S&P 500 Growth ETF (IVW), also performed well in the past 12 months, climbing 35%. Information Technology (41% of assets) stocks like Apple dominate the portfolio, but Consumer Discretionary (16%) and Communication Services (15%) companies provide some diversification. State Street Global Advisors and Vanguard also offer smaller ETFs tied to the S&P 500 Growth Index.
Despite the market favoring growth companies, a value ETF recently shined as well. Invesco S&P 500 Pure Value ETF (RPV) increased 37% in the year ended March 5, topping IVW’s 35% gain. RPV owns the deepest value stocks within the parent index and is rebalanced annually. Financials (42% of assets) stocks were heavily represented, led by life insurer Unum. RPV also outperformed the more diversified iShares S&P 500 Value ETF (IVE), which rose only 20% in the past year.
Lower risk ETFs fell behind. For example, Invesco S&P 500 Low Volatility ETF (SPLV) lost 1.9% in the past year, lagging its wilder child sibling SPHB by more than 8,000 basis points. SPLV owns the S&P 500 constituents with the least volatility in the past 12 months and is rebalanced quarterly. Following the February rebalance, the ETF was heavily weighted to Consumer Staples (26%) and Health Care (21%) companies, such as Bristol Myers Squibb and Kellogg.
Even adding in an income component did not provide a significant boost as Invesco S&P 500 High Dividend Low Volatility ETF (SPHD) rose only 10%, still trailing SPY by almost 2,000 basis points. SPHD owns 50 high-dividend-yielding, low-volatility stocks. Utilities (18% of assets) and Consumer Staples (15%), such as Altria and PPL, are widely held.
Chart 2: Lagging Smart-Beta S&P 500-Based ETF Returns (%)
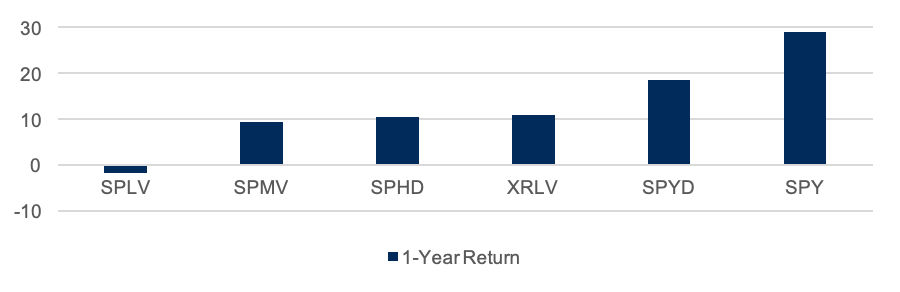
CFRA’s First Bridge ETF Database. As of March 5, 2021.
The exposure to slower growth, more defensive sectors hurt SPLV and SPHD in the past year as investors embraced risk taking and were increasingly optimistic the global economy would emerge from the pandemic in 2021 rewarding more cyclical sectors.
ESG ETFs are not built the same, as evidenced by their performance. For instance, Global X S&P 500 Catholic Values ETF (CATH) rose 31% in the past year, while SPDR S&P Fossil Fuel Reserves Free ETF (SPYX) gained 29%. CATH had a 3% recent stake in energy companies, more than triple that of SPYX.
Conclusion
The S&P 500 Index turned 64 years old recently but continues to provide investors with sound building blocks for alternatively weighted index-based ETFs. In each period, there will be strong and weak performers but understanding what is driving past and future ETF returns is most important.
Todd Rosenbluth is the director of ETF and mutual fund research at CFRA. Learn more about CFRA's ETF research here.


