
I’m no theological scholar, but a phrase from the New Testament always comes to mind when I regard the price history of the Invesco S&P 500 Equal Weight ETF (NYSE Arca: RSP): “… he that is least among you all, the same shall be great.”
What’s the connection? Take a look at the chart below where RSP’s trajectory, depicted by the red line, is put up against that of the SPDR S&P 500 ETF (NYSE Arca: SPY). Over the years, you’ll note that RSP outperforms SPY in a bullish environment. Keep in mind that these two ETF portfolios hold exactly the same stocks. The only difference between them is how all those stocks are weighted. SPY is capitalization weighted, skewing its performance toward the bigger issues. Big stocks don’t dominate RSP. Its equal weighting allows smaller fry to express themselves more fully.
See the connection now? The least of the 500 become great as the market trends up.
Daily Performance: RSP vs. SPY
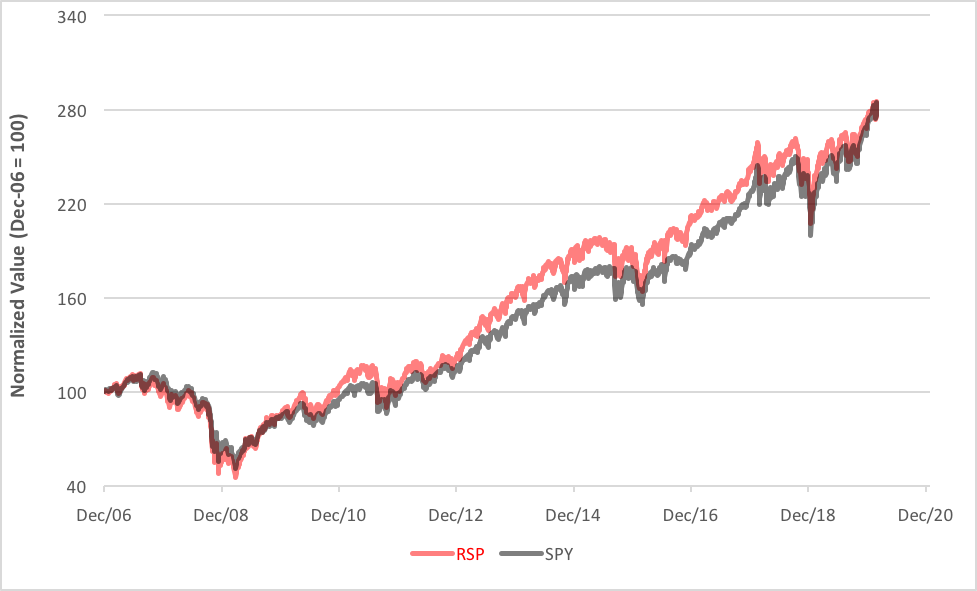
There’s, of course, a flip side. On pullbacks, RSP lags SPY. Smaller stocks become more like dead weights then. The important takeaway is this: RSP leads the way up AND down. When the economy pulls out of recession, as it did in 2009, RSP acts as a more sensitive barometer of improving conditions. As attestation, note how RSP has outgunned SPY ever since August 2009. Until recently, that is. After more than 2,700 trading days, RSP’s cumulative normalized value finally fell below SPY’s on January 30.
So, is it time to bail from stocks? Well, it’s a little premature to make wholesale changes in portfolio allocations, especially in light of Friday’s market action when RSP’s value bounced amid liquidation of long SPY positions. This week’s daily follow-through action will certainly be instructive.
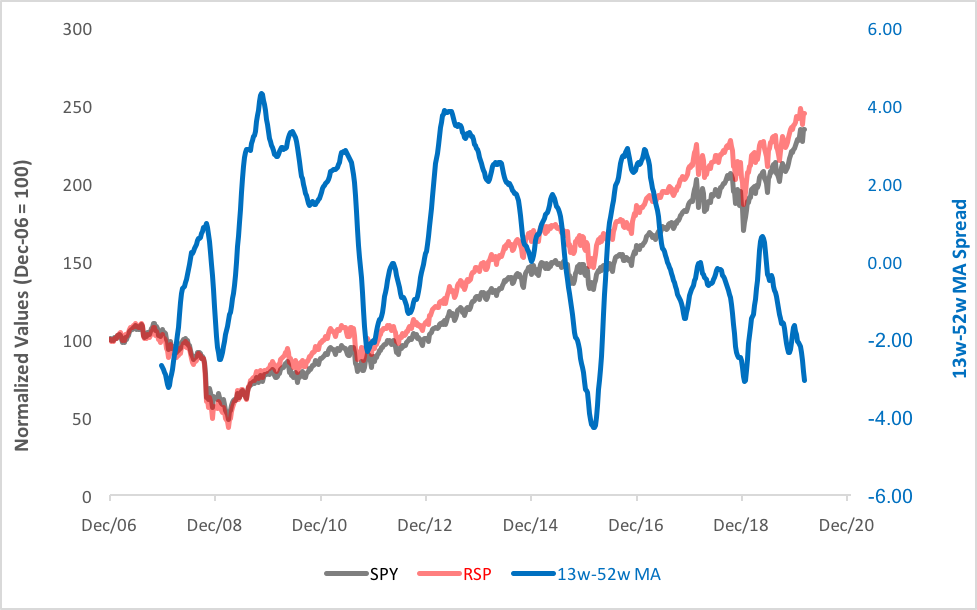
More important, we need confirmation from the weekly chart before we head for the exits. We don’t have that yet, but we may be getting close. The chart below highlights the spread between the 13-week and 52-week moving averages of the ETFs’ normalized values. On a weekly basis, RSP’s still ahead of SPY, but its advantage is dramatically narrowing. The moving average trend confirms the slowing momentum.
Weekly Performance: RSP vs. SPY
You needn’t rush for the exits, but you should at least look about to see where they are.
Brad Zigler is WealthManagement's alternative investments editor. Previously, he was the head of marketing, research and education for the Pacific Exchange's (now NYSE Arca) option market and the iShares complex of exchange traded funds.


