No doubt beta’s been king during our decade-long bull market. Someday though, and perhaps soon, the bull will be slain. It’s then that alternative investments have an opportunity to come into their own again. Alts have been mainly sidelined during most of beta’s reign. For investors seeking absolute returns, it’s really no wonder why. After all, why take the risk if beta is so rewarding?
Recent wobbles in the bull’s legs, though, have given some investors and advisors reason to take a fresh look at alts. Not necessarily to replace equity exposure, mind you, but to diversify portfolio risk in the future.
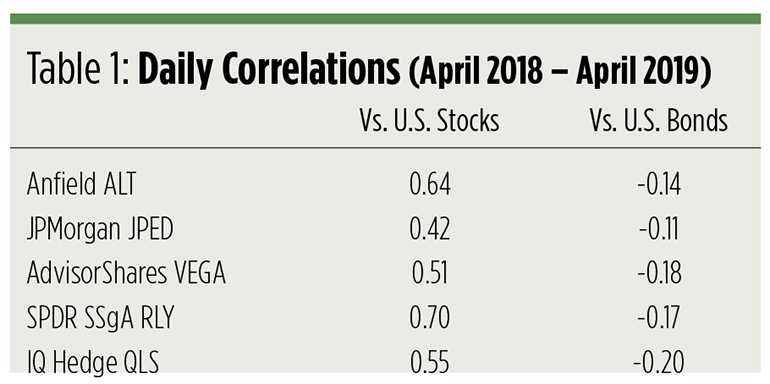
Typically, investors look to alts for non-correlated returns. Unfortunately, when faced with an array of alt investments, correlation is often a difference without much distinction. Recently, there’s been scant variation in the correlation coefficients among alpha-hungry alt ETFs.
Over the past year, five of the largest funds exhibited a weighted average 0.63 correlation to domestic stocks. From top to bottom, coefficients differed by just 28 ticks. The spread in bond correlations has been even narrower. Against a universe of U.S. investment-grade paper, the alt funds earned a weighted average factor of -0.16 within a very tight nine-tick range.
A deeper look
To make a fully informed choice in the alt space, you really have to look beyond correlation to get a sense of how an investment is likely to mesh with your portfolio. You have to consider the shape of the investments’ return distribution. In particular, you have to consider “skewness” and “kurtosis.”
We’re all familiar with the bell-shaped curve associated with normal statistical distributions. If we’re monitoring the frequency of an investment’s returns over time, the bell shape derives from the clustering of returns around the mean, or peak. The tails — the less frequent returns in the distribution — fall away on both sides of the peak toward zero frequency.
Skewness measures the distribution’s symmetry. A normal distribution merits a skewness of zero. Its tails — in the iconic form — are perfectly symmetrical.
A nonsymmetrical distribution earns positive skewness when its right-hand tail (higher-than-average returns) is “fatter” than the tail on its left. When less-than-average returns outnumber frequencies on the right-hand side, the distribution skews negative.
A return history is considered fairly symmetrical when skewness is calculated to be between -0.50 and 0.50. A highly skewed distribution presents a factor less than -1.00 or greater than 1.00.
Kurtosis measures the combined size of a distribution’s two tails. When compared against a normal distribution, it’s reported as “excess kurtosis.” Thus, an excess kurtosis value of zero describes a bell-shaped curve. Kurtosis increases as the tails get heavier, denoting a greater frequency of outlying returns. A lower factor indicates extreme outcomes are less common. Generally, kurtosis ranging between -2.00 and 2.00 connotes a more normal distribution.
So, in the end, kurtosis tells you of the existence of extreme returns and their frequency. Skewness explains their tendency, i.e., whether these returns are more likely to be above or below average.
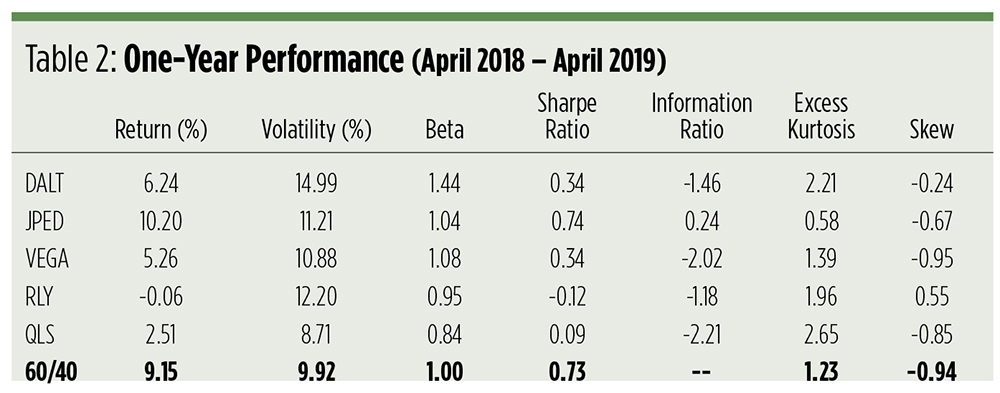
If correlations to common portfolio exposures don’t distinguish alts ETFs from one another, do kurtosis and skewsness provide more insight? How, for example, would various alt ETFs shape up against a balanced (60/40) portfolio of domestic stocks and bonds?
The shape of things now
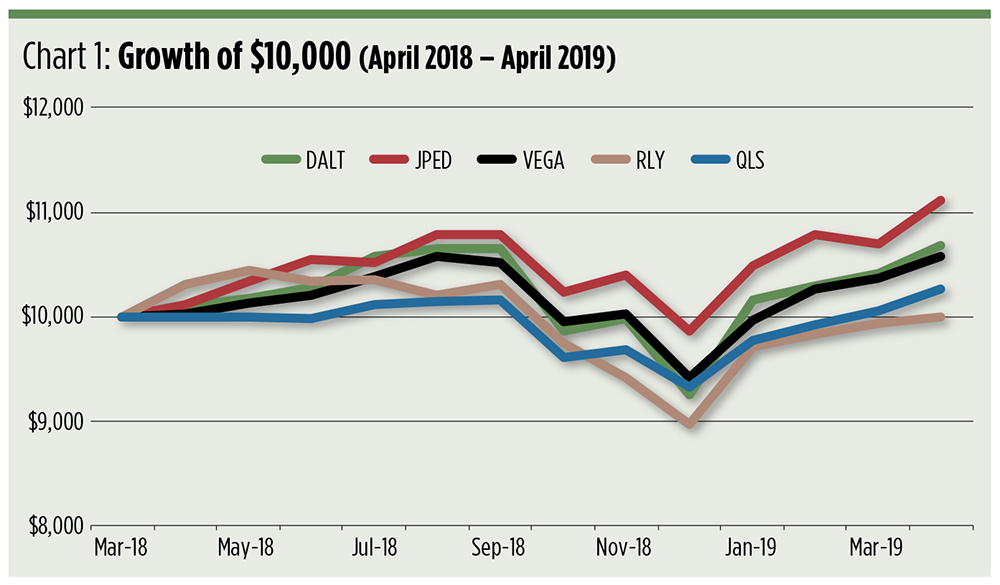
For the most part, alts have lagged a balanced portfolio on an absolute return basis over the past 12 months, largely due to their relatively high volatility and unpredictable returns. Only one of these alpha-seekers actually managed to earn a positive coefficient.
The Anfield Capital Diversified Alternatives ETF (DALT) is a tactical fund of funds that throttles exposure to four asset classes — equity, fixed income, commodities and alternatives. Not quite two years old, DALT’s managers use macroeconomic, fundamental and technical analysis to build a portfolio of 20–30 positions that “do not represent the general investment universe.” Presently, DALT’s exposures feature preferred and convertible stocks, business development companies, real estate investment trust securities and covered call writes, among others.
Though DALT’s performance seems poor on a 12-month basis, the strategy pulled ahead of the pack and even the balanced portfolio on a year-to-date basis. That shouldn’t really come as a surprise, given the portfolio’s kurtosis. DALT’s returns are fat-tailed, but, for the most part, they’re symmetrical. You’re just as likely to get outsize gains as outsize losses. Overall, DALT’s technical picture is bullish in the intermediate and long term.
Another ETF that’s had a bullish, albeit more modest, run this year is the JPMorgan Event Driven ETF (JPED). Launched in 2017, JPED is a long/short equity product that makes investments in companies its advisors deem likely to be affected by corporate or special events such as mergers, spin-offs and reorganizations. Merger arbitrage is most commonly conducted by JPED’s fund runners. The play entails buying shares in the company to be acquired while selling short the acquiring company’s stock.
JPED’s outdone the balanced portfolio on both a one-year and year-to-date basis. It’s the only fund in the table that’s produced positive alpha over the past 12 months. Part of that can be attributed to JPED’s low correlation to the stock and the bond markets. The fund has the lowest kurtosis in our ETF universe along with a fairly small negative skew. This mild variance makes JPED’s current prospect a mixed bag. There’s really no strong technical momentum in either direction.
Despite some near-term weakness, the path of least resistance for the AdvisorShares STAR Global Buy-Write ETF (VEGA) is upward in the intermediate and long term. A seven-year-old fund of funds, VEGA aims to produce consistent returns by writing call options on securities held in the portfolio. The fund’s managers also tactically buy puts to hedge downside risk. The fund’s managers have discretion to trade across a wide range of asset classes, including global equities and bonds, among others. The bulk of the fund’s assets are invested in S&P 500 stocks, partially hedged with puts.
Year to date, VEGA’s barely outdone the return of the 60/40 portfolio, but it’s managed with a lot less kurtosis and skewness.
The SPDR SSgA Multi-Asset Real Return ETF (RLY) is yet another fund of funds, but this ETF’s aims are relatively modest. RLY’s managers use quantitative and fundamental analysis to construct a portfolio seeking returns above the rate of inflation. The seven-year-old fund’s largest exposure is to natural resource companies and commodities. Smaller allocations are made to Treasury Inflation-Protected Securities, real estate and energy companies.
The fund’s high volatility and high correlation to stocks have hurt its 12-month performance. Since the top of the year, the fund’s fared better, though its return still trails that of the balanced portfolio. Looking forward, the fund seems destined to slip lower over the near-term and intermediate-term horizons. This year, RLY’s kurtosis and skewness have been the highest of the five-fund universe.
Overall, the prospects for the four-year-old IQ Hedge Long/Short Tracker ETF (QLS) are favorable, though the fund may have to overcome some near-term dithering. QLS mimics a multi-asset hedge fund strategy by taking long and short positions through ETFs and ETF swaps. Tthe fund’s largest commitments are to curreny-hedged global equities and short-term Treasury notes on the long side and emerging market equities on the short side.
QLS has had modest success on a year-to-date basis, trailing the return of the balanced portfolio. The fund’s hallmark is its low volatility. This year, the fund also exhibited lighter kurtosis and skew compared with the 60/40 strategy.
The shape of things to come
Like many other asset classes, alts are on the rebound from a late-2018 slump. Many investors were surprised to find their alternative investments didn’t really provide much of a complement to beta last year. Assets were more highly correlated than many believed them to be.
If historic correlations don’t provide much insulation from equity market turmoil, investors may have to rely more upon kurtosis and skewness for clues about their alternative investments’ potential behavior. These metrics need to be considered in conjunction with correlations to shape an outlook.
Over the past 12 months, the JPMorgan Event Driven ETF produced an optimal combination of low correlation, volatility and shape statistics to emerge as a top performer. Does JPED have the right stuff to continue producing positive alpha?
Time will tell. For now, JPED seems to be setting the pace for alt ETFs.
Brad Zigler is WealthManagement's Alternative Investments Editor. Previously, he was the head of Marketing, Research and Education for the Pacific Exchange's (now NYSE Arca) option market and the iShares complex of exchange traded funds.


