
Exchange-traded funds (ETFs) are a wonderful invention. Sure, they provide low-cost, tax-efficient alternatives to other types of collective investments but they are also easily observable indicators of market sentiment.
If you look at a chart tracking the price ratio of the Consumer Discretionary Select Sector SPDR ETF (NYSE Arca: XLY) and the Consumer Staples Select Sector SPDR ETF (NYSE Arca: XLP), you might think we’re headed into an economic version of the Era of Good Feelings.
Why? Because XLY (discretionary) stocks are pulling ahead of the XLP (staples) issues. XLY is populated by companies that produce stuff you want to buy; XLP is made up of companies making goods you have to purchase. The big holdings in the XLY portfolio include Amazon.com, Inc. (Nasdaq: AMZN), Walt Disney Co. (NYSE: DIS) and Home Depot, Inc. (NYSE: HD). XLP’s weighted by the likes of Proctor & Gamble (NYSE: PG), CVS Health Corp. (NYSE: CVS) and Costco Wholesale (Nasdaq: COST).
The rise in the ratio is evidence of consumers’ willingness to spend more of their money on non-essentials. After all, you gotta be confident about your financial resources before laying out your hard-earned bucks for a Star Wars flick.

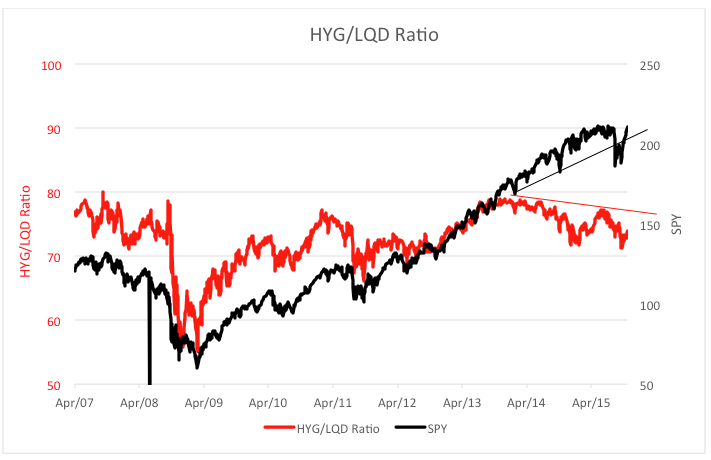
To the extent the XLY/XLP chart is encouraging, the HYG/LQD graph is troubling. HYG is the iShares iBoxx $ High Yield Corporate Bond ETF, a proxy for junk bonds. The iShares iBoxx $ Investment Grade Corporate Bond ETF (NYSE Arca: LQD) represents higher-quality corporate debt. Divide the price of HYG by LQD’s cost and you get a different angle on economic buoyancy. The higher the HYG/LQD ratio, the more willing are investors to undertake risk. As you can see from the chart below, the ratio moved fairly well in lockstep with the stock market -- represented by the SPDR S&P 500 ETF (NYSE Arca: SPY) – through late 2013. Then, the ratio began to narrow as stocks continued northward.

To say that the ratio is a leading indicator for the stock market is something of an understatement. The ratio started topping 18 months before SPY actually heeled over. As the warning signal flashed in the background, speculative buying continued unabated. No real SPY topping pattern emerged until this summer.
So now SPY seems to be regaining its footing and the XLY/XLP ratio is breaking to the upside. HYG/LQD is still foundering, though You may well ask which of these indicators to believe.
Well, all of ‘em. If you’re already fully invested in equities, enjoy the ride. If you’re not, wait for the XLY/XLP ratio to show signs of bottoming before jumping aboard the equity train.
Brad Zigler is REP./WealthManagement's Alternative Investments Editor. Previously, he was the head of marketing, research and education for the Pacific Exchange's (now NYSE Arca) option market and the iShares complex of exchange traded funds.


