
While BlackRock is the ETF leader, the U.S. sector and industry ETF subcategory is dominated by State Street Global Advisors. BlackRock manages 35% of all U.S.-listed ETF assets as of Sept. 17, according to CFRA’s ETF data, ahead of Vanguard (29%) and State Street Global Advisors (15%), but there are some investment approaches where peers have a leg up. For example, State Street has a 44% share of the U.S. sector and industry ETF market, leading peers Vanguard (26%) and BlackRock (15%) as well as other providers such as Fidelity, First Trust and Invesco. Sector and industry ETFs are typically market cap weighted yet provide investors with diversification within a sector such as financials or information technology rather than owning just a few securities.
Figure 1: U.S.-Listed ETF Market Share (% of assets)
CFRA’s ETF database. As of September 17, 2021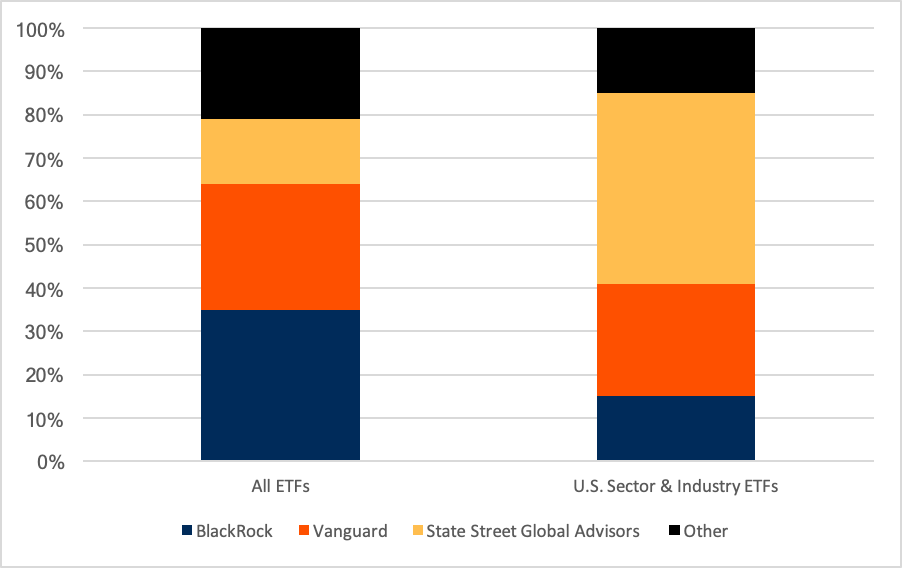
Sector ETFs may sound the same, but they do not perform the same. For example, Vanguard Financials ETF (VFH) rose 57.5% in the 12-month period ended Sept. 17, modestly ahead of a 54.9% gain for Financial Select Sector SPDR ETF (XLF) and significantly stronger than the 44.3% gain for iShares US Financials (IYF). While VFH has the lowest expense ratio of the trio (0.10% vs. 0.12% for XLF and 0.42% for IYF), costs are not the main driver of the performance gap, the ETF holdings are.
Figure 2: Performance of Select Financials-Focused ETFs (%)
CFRA’s ETF database. As of September 17, 2021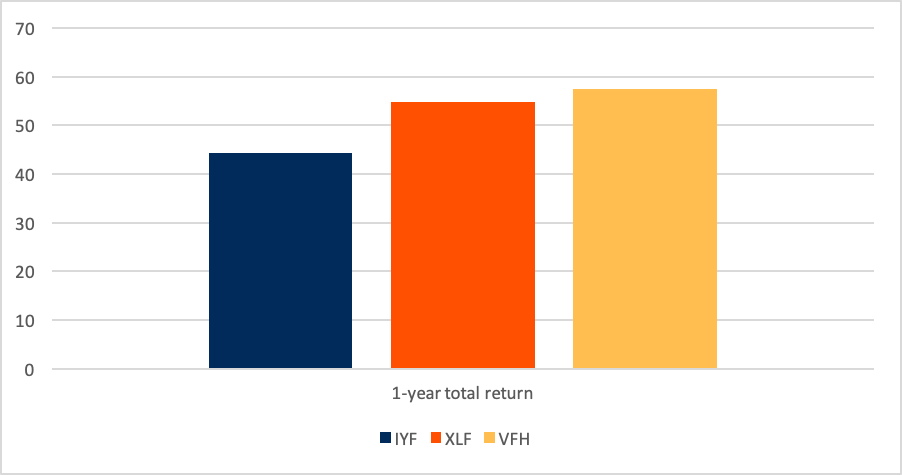
XLF owns just the stocks within the Financials sector of the S&P 500 Index, while VFH owns some small and mid-cap financial stocks that are not part of the large-cap index such as Cowen and Janus Henderson Group. However, IYF historically was constructed quite differently. Prior to BlackRock changing the underlying benchmark for IYF at the end of last week, IYF held a 20%-of-assets stake in real estate companies such as American Tower and Prologis along with exposure to JPMorgan and Wells Fargo. Real estate stocks have historically provided more defensive characteristics than financials and rallied less during market recoveries.
IYF is now tracking the Russell 1000 Financials 40 Act 15/22.5 Daily Capped Index, which unlike the Dow Jones U.S. Financials Capped Index, excludes real estate companies so REITs are no longer inside. Going forward, we expect IYF to perform more in line with peers XLF and VFH, but this example highlights why investors should not solely rely on past performance since holdings can and do change within an index ETF.
Despite its recent benchmark change, iShares U.S. Technology ETF (IYW) still looks different from its peers. Many investors still think of Alphabet and Facebook as information technology stocks just like Apple and Microsoft years after they were shifted to the Communications Services sector in the GICS framework and sold out of Technology Select Sector SPDR (XLK) and Vanguard Information Technology ETF (VGT). Those investors will be happy to still find all four companies inside IYF, representing nearly 50% of assets, despite BlackRock also shifting from a Dow Jones sector benchmark to a Russell one last week for IYW.
In the one-year period ended Sept. 17, 2021, IYW rose 46% ahead of the 40% and 38% gains for VGT and XLK despite a higher expense ratio. Exposure to mega-cap Communications Services companies, as classified using the GICS framework, helped drive IYW higher. Like VFH, VGT owns some stocks not held in peer ETFs such as Cloudera and Square.
Figure 3: Performance of Select Technology-Focused ETFs (%)
CFRA’s ETF database. As of September 17, 2021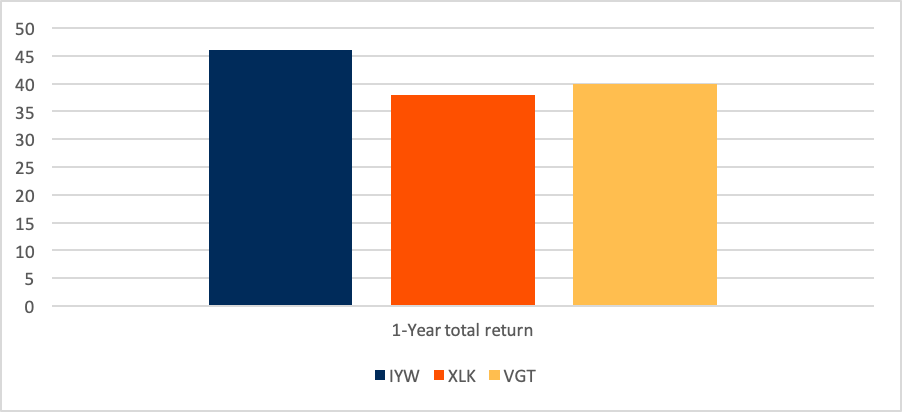
Conclusion
Many investors will choose either the cheapest or the best-performing ETF within an investment style, believing what is inside is basically the same. However, sector ETFs from the three largest U.S. ETF providers have historically been quite different. Even with BlackRock changing benchmark providers for some of its ETFs, what is inside its ETFs is not the same as peers. CFRA’s forward-looking ETF star ratings combine analysis of fund costs, past performance and proprietary holdings analysis to help investors with the ETF research to understand the risk and reward distinctions between similar-sounding funds.
Todd Rosenbluth is the director of ETF and mutual fund research at CFRA. Learn more about CFRA's ETF research here.