
Luckily, when looking for signs of market momentum, it’s easier to read charts than tea leaves. And some of those charts are giving off good vibes now.
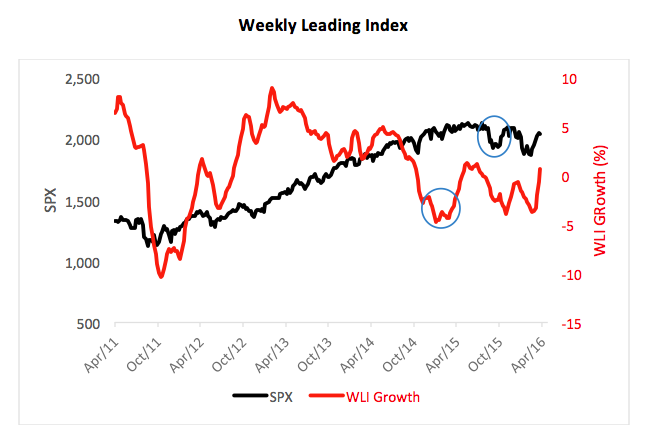
First of all, there’s the Weekly Leading Index (WLI) put out by the Economic Cycle Research Institute. Year-over-year growth in the WLI has just inched into positive territory for the first time in a year. WLI is designed to anticipate economic turning points two to three quarters in advance. You can see this played out in the chart below.
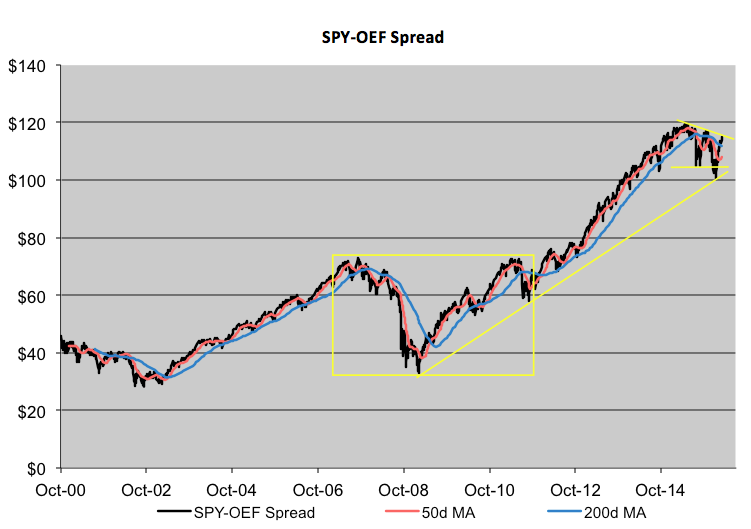
More immediately, investors seem interested in taking on equity risk. Just look at the price spread between the S&P 500 SPDR ETF (NYSE Arca: SPY) and the iShares S&P 100 ETF (NYSE Arca: OEF). OEF’s stocks are a subset—the largest-capitalized and most defensive issues—of SPY’s. When investors are enthusiastic about the market’s upside, they favor SPY. OEF fares better when punters pull in their horns.
The SPY-OEF spread’s rebounded from a test of its long-term uptrend and is now toying with overhead resistance. A decisive breakout above $115 would signal renewed market strength.
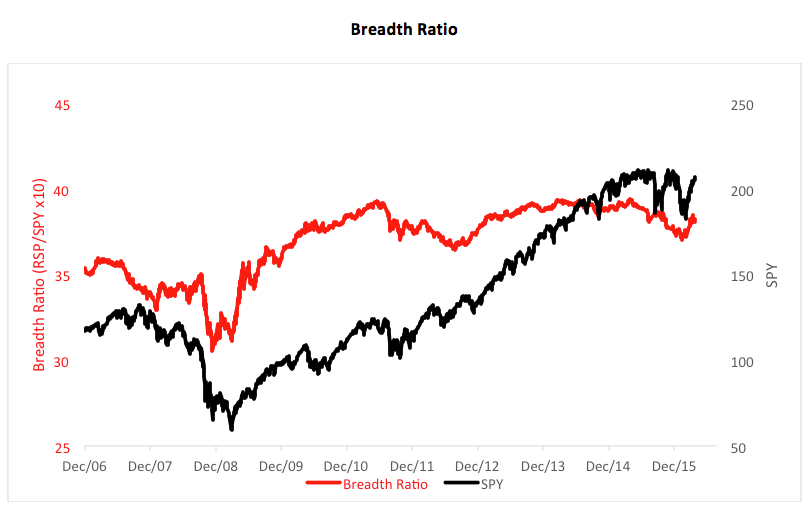
There’s breadth in the market’s recent upside move as well, exemplified by another pair of ETFs. Put the price of the Guggenheim S&P 500 Equal Weight ETF (NYSE Arca: RSP) to SPY in ratio and you get a barometer smaller-cap stock participation. This breadth ratio’s finally turned up after downtrending for nearly a year.
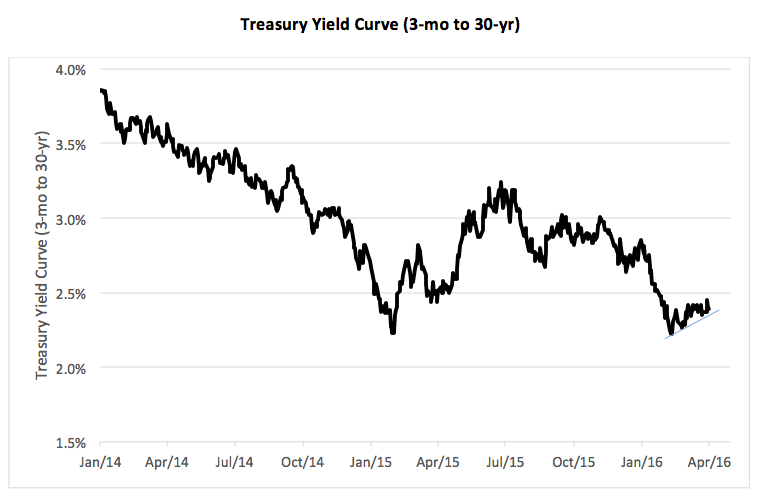
On the bond side, the yield curve’s started to steepen after being flattened in the first quarter, which will ultimately have ameliorative effect on financial stocks. And just in time, too, because financials along with health care equities, have been lagging.
So, after moving up six of the past seven weeks and gaining more than 250 points, the S&P 500 is trying to break out of a rounding top pattern. April’s often a very friendly month for equity bulls. Perhaps this April will be friendlier still.
That’s at least what the tea leaves, er, charts seem to indicate.
Brad Zigler is REP./WealthManagement’s Alternative Investments Editor. Previously, he was the head of marketing, research and education for the Pacific Exchange’s (now NYSE Arca) option market and the iShares complex of exchange traded funds.


