Download the full-size pdf
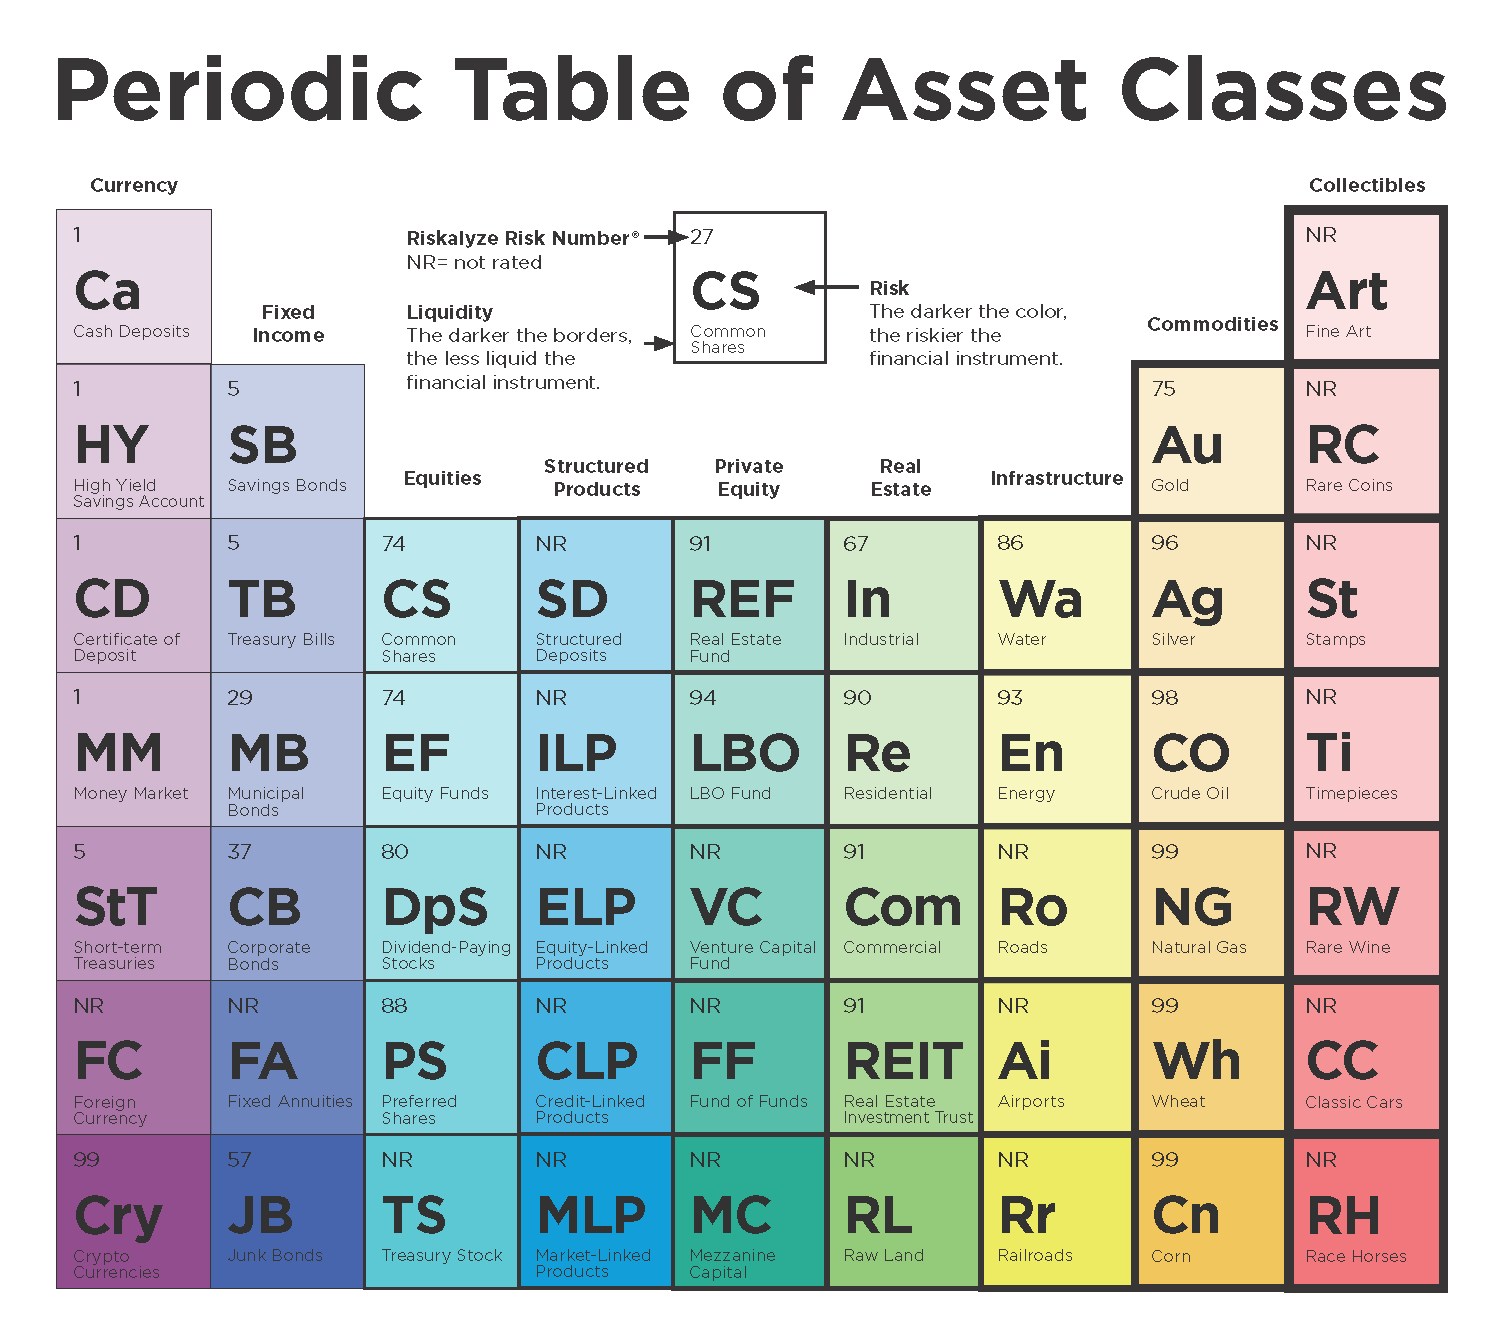
There are nine asset classes grouped in columns. From left to right, the financial instruments in columns are arrayed from most liquid to least liquid. This trend maps to instruments associated with financial assets and instruments having to do with real assets. The financial instruments on the left are most readily converted into cash without affecting their market price. The financial instruments on the right cannot readily be converted into cash without a substantial loss in value.
The financial instruments in each asset class group display similar liquidity characteristics with differing tolerances for risk. From top to bottom, the financial instruments are arrayed from those historically identified with the least risk to those identified with the most risk.
The Periodic Table of Asset Classes is best perceived as a general organization of financial instruments arrayed in terms of relative liquidity and risk tolerance. Taken as a whole, the organization of the table displays the general relationships between the nine asset classes. It is not to be taken as fixed and unchanging. In any given year, the individual financial instruments within any asset class may shift up or down. The relative positions of the instruments within the asset classes display remarkable consistency, however. n
The Risk Number is a proprietary index developed by Riskalyze to express relative risk. A higher Risk Number equates with higher levels of risk. The editors thank Riskalyze for its input here and permitting the use of its Risk Number index.
By John Kador. Design by KathleenKowal.com