
The recent wave of 2016 earnings reports brought cheers for the supposed end of the “earnings recession.” Analysts are saying that earnings growth is accelerating. However, quarterly earnings omit valuable information. They are unaudited and don’t provide financial footnotes or the management discussion and analysis (MD&A) that investors need to accurately measure profits.
The footnotes and MD&A are present only in annual 10-K reports, which is why 10-K filing season (late February to the end of March) should be the most important time of year for analysts and investors. In reality, these reports and the important details in them are overlooked because most investors and analysts do not have the time to read these dense reports, often running to 200 or more pages. Our Robo-Analyst technology automates the mundane parts of analyzing 10-Ks so that our analyst team can review all of them with more precision than traditional analysts.
Our analysis of the latest 10-K filings for the more than 2,600 largest and most actively-traded companies (a good proxy for the overall market) shows that the much-hyped end to the earnings recession is an accounting illusion. Our review of more than 500 first quarter financial reports that have been published so far show the illusion continuing.
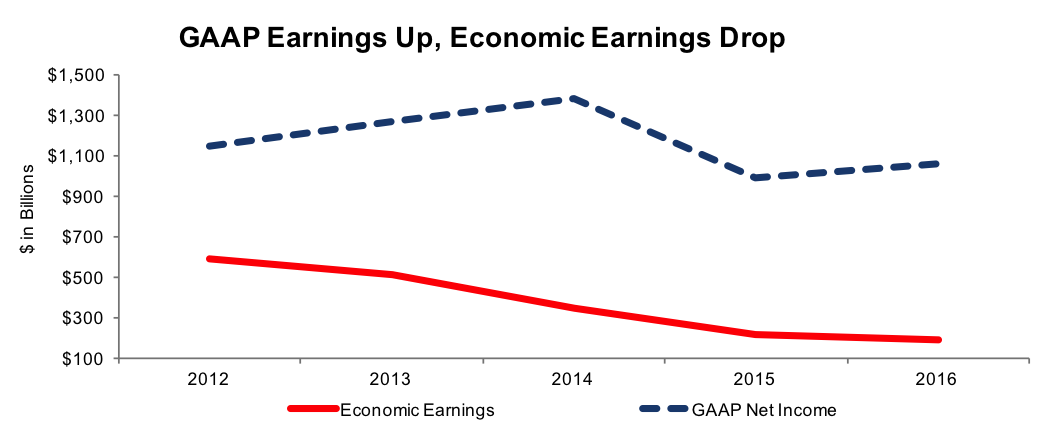
Figure 1: GAAP Earnings Offer Misleading Trend in Profits in 2016
Sources: New Constructs, LLC and company filings.
Figure 1 paints a much less rosy picture for investors looking for an earnings recovery. GAAP net income may have risen $72 billion, but economic earnings fell $26 billion. 2016’s drop in economic earnings was smaller than the $129 billion decline in 2015, but there’s definitely no recovery in corporate profits.
The primary difference between GAAP earnings and economic earnings is that economic earnings reverse accounting distortions and capture changes in balance sheets. The most important drivers of economic earnings are net operating profits after tax (NOPAT) and invested capital, the measure of all capital invested in a business over its life regardless of financing form.
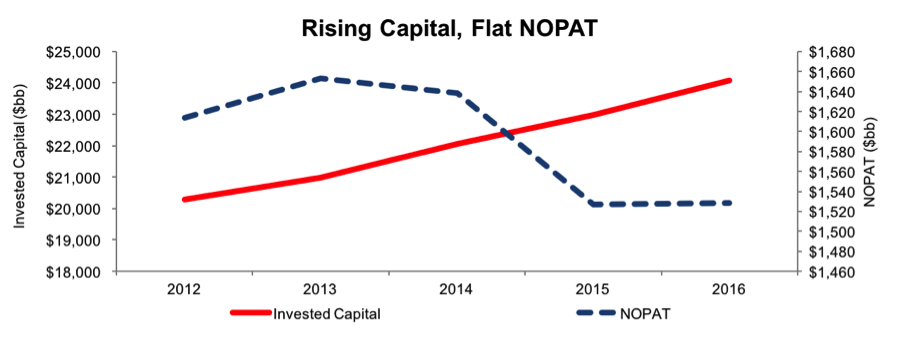
Figure 2 shows the source of the discrepancy between GAAP and economic earnings comes mostly from invested capital growth that has not resulted in growth in NOPAT. Specifically, in 2016, companies increased invested capital by $1.1 trillion of capital while NOPAT was flat. This analysis shows how companies can grow accounting earnings through financial engineering even though cash flows are declining.
Figure 2: Trends In Net Operating Profit After Tax & Invested Capital For The Broader Market
Sources: New Constructs, LLC and company filings.
Why was NOPAT flat when GAAP net income rose last year? When we analyzed the footnotes for these companies, we discovered 21,094 adjustments with a total value of $1.1 trillion that applied to GAAP income statement results.
However, as noted above, it’s the growth in invested capital that drives the biggest wedge between GAAP earnings and economic earnings. We had to look in the footnotes to find the truth about the growth in balance sheets as well because companies hid most of this growth by writing assets down.
Asset write-downs allow companies to erase assets and shareholder equity from the balance sheet forever with a stroke of a pen. You see the charges for write-downs on the income statement about 75 percent of the time.
To hold companies accountable for all capital put into their business, we include written-down assets (after tax) in our calculation of invested capital. We also add the charges for them on the income statement back to our calculation of NOPAT. In short, we normalize the effect of these unusual events for our calculation of economic earnings (and ROIC).
In 2015, companies wrote down $350 billion of assets, $78 billion of which were hidden in the footnotes or MD&A. These write-downs were driven largely by falling commodity prices.
As commodity prices stabilized in 2016, companies wrote down only $192 billion in assets, $63 billion of which were hidden in the footnotes and MD&A.
Unusually large write-downs in 2015 drove GAAP earnings artificially low comps, which set up good comps and allowed companies to report rising GAAP earnings in 2016 despite a lack of any real increase in operating profit and an economic earnings decline. The end of the earnings recession is an accounting mirage.
David Trainer is the founder of market research firm New Constructs. Neither David Trainer nor Sam McBride receives compensation to write about any specific stock, sector, style, or theme.


