The mid-cap blend style ranks ninth out of the twelve fund styles as detailed in my Style Rankings for ETFs and Mutual Funds report. It gets my Dangerous rating, which is based on aggregation of ratings of 17 ETFs and 332 mutual funds in the mid-cap blend style as of February 8th, 2013. Prior reports on the best & worst ETFs and mutual funds in every sector and style are here.
Figures 1 and 2 show the five best and worst-rated ETFs and mutual funds in the style. Not all mid-cap blend style ETFs and mutual funds are created the same. The number of holdings varies widely (from 19 to 3009), which creates drastically different investment implications and ratings. The best ETFs and mutual funds allocate more value to Attractive-or-better-rated stocks than the worst, which allocate too much value to Neutral-or-worse-rated stocks.
To identify the best and avoid the worst ETFs and mutual funds within the mid-cap blend style, investors need a predictive rating based on (1) stocks ratings of the holdings and (2) the all-in expenses of each ETF and mutual fund. Investors need not rely on backward-looking ratings. My fund rating methodology is detailed here.
Investors should not buy any mid-cap blend ETFs or mutual funds because none get an Attractive-or-better rating. If you must have exposure to this style, you should buy a basket of Attractive-or-better rated stocks and avoid paying undeserved fund fees. Active management has a long history of not paying off.
Get my ratings on all ETFs and mutual funds in this style on my free mutual fund and ETF screener.
Figure 1: ETFs with the Best & Worst Ratings – Top 5
 * Best ETFs exclude ETFs with TNAs less than $100 million for inadequate liquidity.
Sources: New Constructs, LLC and company filings
PowerShares RAFI Fundamental Pure Mid Core Portfolio (PXMC), Guggenheim Mid-Cap Core ETF (CZA), and Rydex Russell Midcap Equal Weight ETF (EWRM) are excluded from Figure 1 because their total net assets (TNA) are below $100 million and do not meet our liquidity standards.
Figure 2: Mutual Funds with the Best & Worst Ratings – Top 5
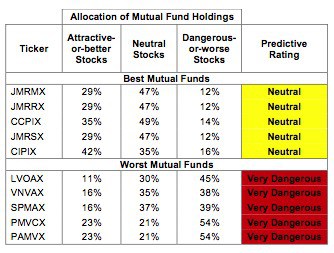 * Best mutual funds exclude funds with TNAs less than $100 million for inadequate liquidity.
Sources: New Constructs, LLC and company filings
Four mutual funds are excluded from Figure 2 because their total net assets (TNA) are below $100 million and do not meet our liquidity standards.
iShares Morningstar Mid Core Index Fund (JKG) is my top-rated mid-cap blend ETF and JPMorgan Trust I: JPMorgan Mid Cap Core Fund (JMRMX) is my top-rated mid-cap blend mutual fund. Both earn my Neutral rating.
Vanguard Extended Market ETF (VXF) is my worst-rated mid-cap blend ETF and earns my Dangerous rating. Pacific Advisors Fund Inc: Mid Cap Value Fund (PAMVX) is my worst-rated mid-cap blend mutual fund and earns my Very Dangerous rating.
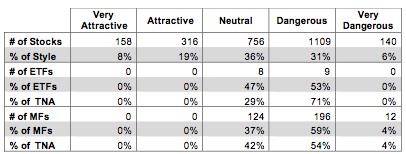
Figure 3 shows that 474 out of the 2479 stocks (over 27% of the market value) in mid-cap blend ETFs and mutual funds get an Attractive-or-better rating. However, none of 17 mid-cap blend ETFs and none of the 332 mid-cap blend mutual funds get an Attractive-or-better rating.
The takeaways are: mutual fund managers allocate too much capital to low-quality stocks and mid-cap blend ETFs hold poor quality stocks.
Figure 3: Mid-cap Blend Style Landscape For ETFs, Mutual Funds & Stocks
 Sources: New Constructs, LLC and company filings
As detailed in “Cheap Funds Dupe Investors”, the fund industry offers many cheap funds but very few funds with high-quality stocks, or with what I call good portfolio management.
Investors need to tread carefully when considering mid-cap blend ETFs and mutual funds, as no ETFs or mutual funds in the mid-cap blend style allocate enough value to Attractive-or-better-rated stocks to earn an Attractive rating. Focus on individual stocks instead.
Fluor Corporation (FLR) is one of my favorite stocks held by mid-cap blend ETFs and mutual funds and earns my Very Attractive rating. FLR has grown after tax cash flow (NOPAT) by 19% compounded annually over the past 10 years. This growth has fueled a top quintile return on invested capital (ROIC) of 31%. Despite these numbers, the market has extremely modest expectations for Fluor’s future growth. A share price of ~63.40 gives it a price to economic book value ratio of 1.1. This ratio implies that the market expects FLR to grow NOPAT by only 10% and then never grow again. FLR’s board seems to think their stock is undervalued as well. They just approved an increase of 8 million shares to the company’s share repurchase program. Such confidence from within the company, as well as strong historical performance, should make investors feel confident about betting on FLR.
Equinix Inc. (EQIX) is one of my least favorite stocks held by mid-cap blend ETFs and mutual funds and earns my Very Dangerous rating. EQIX has not earned positive economic earnings since at least 2000 when our model begins. Reported earnings per share of $1.70, however, have led the market to overvalue this stock. At a share price of ~$218.00, EQIX has a price to economic book value ratio of 15.0. This valuation implies a 17% growth in NOPAT compounded annually over the next 17 years. EQIX has shown a small amount of growth over the past couple of years, but not enough to justify those expectations. A company earning negative economic profits with a high valuation is bad risk/reward for investors.
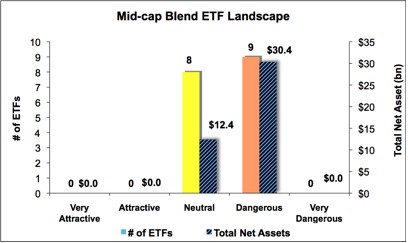
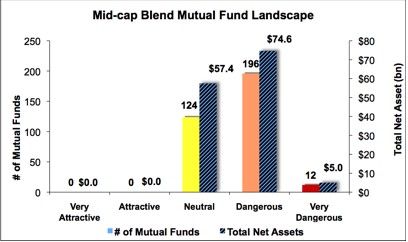
Figures 4 and 5 show the rating landscape of all mid-cap blend ETFs and mutual funds.
My Style Rankings for ETFs and Mutual Funds report ranks all styles and highlights those that offer the best investments.
Figure 4: Separating the Best ETFs From the Worst Funds
 Sources: New Constructs, LLC and company filings
Figure 5: Separating the Best Mutual Funds From the Worst Funds
 Sources: New Constructs, LLC and company filings
Review my full list of ratings and rankings along with reports on all 17 ETFs and 332 mutual funds in the mid-cap blend style.
Sam McBride contributed to this report.
Disclosure: David Trainer owns FLR. David Trainer and Sam McBride receive no compensation to write about any specific stock, sector or theme.