
By Brandon Kochkodin
Rick Selvala stands up from a conference room table in the Graybar Building above Grand Central Terminal and starts drawing up his play on the glass walls of the office: Sell S&P 500 index call and put spreads. Generate cash flow in a tax-efficient manner. Limit downside and liquidity risk.
It looks simple. Decades of practice have that effect.
Harvest Volatility Management LLC, the firm Selvala co-founded in April 2008, targets family offices and wealthy individuals with more than $5 million in liquid assets. Once known for focusing on accounting and tax planning, family offices have come to resemble boutique investment firms. That transformation has allowed the offices to reap premium hedge fund talent who’ve sought an escape from an industry beset by poor performance. Harvest, which has more than $10 billion in assets under management, has positioned itself as an outside resource for adding incremental returns by trading options.
Selvala was previously the co-head of Volaris, formerly a volatility management unit of Credit Suisse Group AG. The group, he says, was primarily known for writing covered calls for clients with big concentrated stock positions. When he left to start Harvest, he decided to focus on ways to take advantage of market volatility without forcing clients to root against their own stocks. What he created, he says, was a market-agnostic strategy to generate incremental yield by trading S&P 500 options.
The basic construct of Harvest’s Collateral Yield Enhancement Strategy (CYES) is to create so-called iron condors, an industry term that refers to the birdlike image produced when you graph the strategy’s profit/loss. Harvest aims to set its spreads so the index price will remain in a “fairway” created by selling a put contract below the current S&P price and selling a call above the current price. Selling each of those contracts creates an immediate net credit in an investor’s account, generating cash flow into the portfolio. Risk is mitigated by buying cheaper out-of-the-money puts and calls to rule out substantial losses. The team then continually recalibrates by staggering positions and using different expiration dates and strike prices to adjust to ongoing market changes.
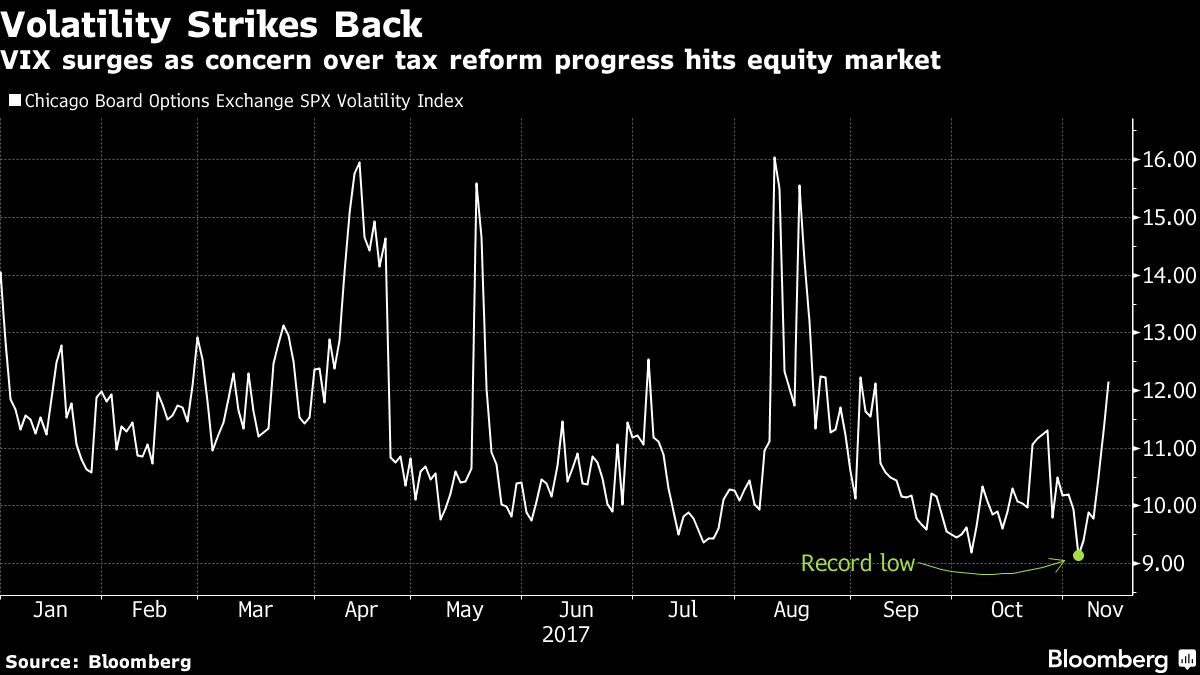
The condor approach allows Harvest to produce returns regardless of whether the S&P is up or down, or if the CBOE Volatility Index (VIX) is hammered below 10 or spiking to 40, as it did in August 2015 when the Chinese government devalued the yuan. While this year has seen record calm in the U.S. equity market, volatility surged from an all-time low in November on concern over prospects for tax reform.
“For anybody who thinks adding 2 percent doesn’t really move the needle, well, most of these portfolios are pretty conservatively managed. If these portfolios are targeting 4 to 6 percent with mid-single-digit volatility, you add 2 to that, that’s a meaningful pickup,” Selvala says. “And it’s all cash. It’s cash that can be reinvested, spent, or used for philanthropic purposes.”
Harvest’s best clients tend to have a history in trading options, according to Selvala. Anybody can trade options, he says, but clients quickly realize it’s cheaper and more efficient to offload management of the strategy to Harvest. That’s because the firm’s volume has allowed it to get close to midprice execution with its brokers, and its relationship with advisers such as Merrill Lynch, Morgan Stanley, and UBS makes it simple to integrate Harvest’s strategy with an existing portfolio.
The tax-efficient strategy qualifies for a 60-40 capital-gains treatment: 60 percent of the gain or loss can be treated as a long-term capital gain regardless of whether the position was held for more than a year. That’s because options on broad-based indexes are considered nonequity under Internal Revenue Code section 1256.
Part of Harvest’s risk-mitigation strategy is to keep a lookout for the known unknowns. That means tracking how known events with unknown outcomes are influencing implied volatility. To do that, the team uses Bloomberg functions such as {TOP} to track current news coverage. With early warnings about major events that could potentially wreck markets, Harvest can completely unwind its positions. In the runup to the 2016 presidential election, the team decided to get out rather than face a potentially unpredictable market. “It’s quite common for us to take off our positions, at least 25 percent, in front of the unknowns,” Selvala says. “For the presidential election it was 75 percent of our positions to limit risk.”
China’s devaluation of the yuan in August 2015 resulted in the S&P 500 falling about 10 percent over the course of a week while the VIX exploded to 40, making put and call options much more expensive to buy. That August, Harvest ended up taking a loss of a little more than 1 percent, its worst monthly return in the past five years. But by staying on top of implied vs. realized volatility, checking functions such as {VCA}, the team was able to recoup more than 70 basis points that September by selling puts and calls at an elevated price, while banking on volatility to settle back to historical norms.
The Harvest team can adjust to changing events quickly because it’s trading deeply liquid options. The result has been a track record of 8 positive years out of 10. “We don’t chase the last nickel over a cliff,” Selvala says.
The strategy isn’t perfect. It resulted in annual losses for the firm of 0.6 percent in 2013 and 2014. The latter year, in particular, was marked by several V-shaped market moves. V-shaped moves make it difficult to set fairways because the market’s momentum changes too quickly, requiring a more dramatic recalibration, which can be costly. Indeed, 2014 was a roller coaster from the start. The S&P 500 was at 1,844 on Jan. 22 , then fell 5 percent over the next two weeks. Just as quickly as it tumbled, by the end of February the index regained all it had lost. There were four of these swift reversals in 2014. For comparison, no such V-shaped move in 2017 has been higher than 2 percent on either leg.
Those limitations are exactly what Harvest clients such as Arcus Capital Partners LLC, an investment adviser, are looking for in an income-generating strategy. “By and large, it’s been a very attractive alpha generator for our clients,” says Ross Singletary, managing partner at Arcus Capital. “In theory, we can do this, but it would necessitate having an entire team to trade this every day. I’m a big believer in specialization of labor and believe Harvest does a great job doing this.”
Track Volatility
The Harvest team uses {VCA} to see how implied volatility stacks up against realized volatility. When implied volatility, an estimate of future volatility, is higher than realized volatility, options premiums are possibly overvalued. In this case, Harvest might sell an option at the inflated premiums created by expectations of higher volatility and buy further out-of-the-money options to limit its risk. To check the spread between implied and realized volatility for an index, go to {VCA} and select the second tab, 6) Impl/Realized Vol. Then select Index under the drop-down menu in the upper left corner. Set the Term drop-down in the upper right-hand corner to 3 months and the Range to 1 year. The term sets the length of the option, and the range is the period of comparison.
Implied volatility on Nov. 10 was 5.34 points higher than realized. That’s a wider spread than the average over the past year.
To view changes in the forward curve, the team regularly checks Bloomberg’s Commodity Curve Analysis. Type “SPA Index” into the terminal command line and select it from autocomplete to load up the S&P 500 futures contracts. Then run {CCRV}. In the upper right corner, select Curves, and in the drop-down menus under Dates, select which curves you’d like to include. On the bottom right, switch Curve Segment to Start and End to see the full curve. Then go to the Settings tab in the upper right and switch to Generic Month under Change X-Axis. This will line up the futures curves to make for an easier comparison. Comparing how futures curves have changed over time is an easy way of visualizing changes in market sentiment.


