
After last year's robust stock market performance, returns this year seem a bit meager by comparison. This is especially true of the kind of big, blue chip companies that make up the DJIA, which is up only 1.51% for the first half of the year. This may be one of the reasons behind the topic of conversation that seems to be popping up more frequently lately. Many investors – including many conservative investors – appear to be asking themselves if they're being too cautious now that some of the major stock indices are hitting all-time highs.

Losses in the past may not seem so bad in retrospect once they’ve been recovered. The “New Paradigm” of internet stocks set the stage for a dot com disaster that lopped more than 70% off the value of the NADSAQ, but today’s investors still pile into social media stocks. The idea that real estate never goes down was shattered by the housing bust that ushered in the “Great Recession”, but home prices around the country have rebounded as more buyers decide it’s time to move in. While markets are falling investors can’t know for certain from moment to moment whether the damage to their account values will be relatively mild and temporary – or severe with permanent consequences. Investors may be starting to think that they could have endured more risk after all now that the market has bounced back – even those investors who clearly remember suffering through painful market declines just a few years ago, and who bailed out of their stocks as they were plummeting.
The desire to become more aggressive now reflects an understanding that in order to target higher returns an investor should be prepared to experience more risk. Still, how often does an investor translate this understanding of the link between risk and return into what that can actually mean in the real world:
“I’d like to have bigger and more frequent losses in my portfolio.”
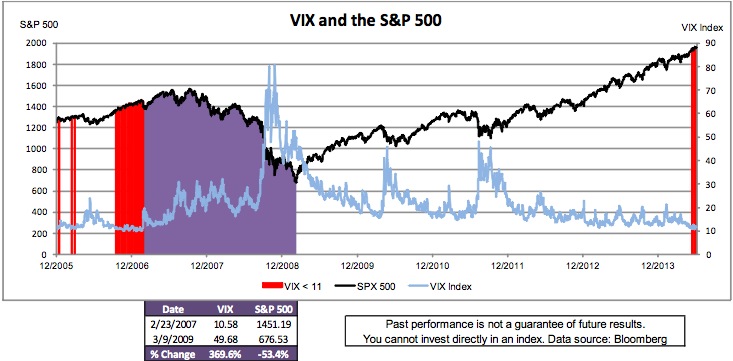
Of course when markets are calm it’s harder to imagine that big losses could be waiting just around the corner, and the stock market has been very calm lately. In fact, by one measure of market volatility, the VIX, it has rarely ever been as calm as it has been lately. According to the Chicago Board Options Exchange, the CBOE Volatility Index or VIX is “considered by many to be the world's premier barometer of investor sentiment and market volatility.” A high VIX generally accompanies extreme market distress. A low VIX tends to follow a period of market gains, and to coincide with optimistic investor sentiment, confidence, and (according to some market watchers) complacency about potential risks.
Are investors worried today? Based on the action in the VIX, it would appear that they are not. Since the beginning of 2006 the VIX has averaged just over 21. At the end of the most recent quarter, the VIX closed at 11.57, and it closed under 11 six times in June. The last time the VIX traded lower than 11 was back on February 23, 2007 when the S&P 500 was at 1451.19. What happened next? Almost exactly two years later, on March 9, 2009, the S&P 500 closed at 676.53 – a decline of more than 53%.
Does this mean stocks are destined to fall anytime soon? Not necessarily. Over the eight months between February 23 and October 29, 2007 the S&P 500 rose by 7.85% before beginning its slide.
Today there are signs the economy is recovering, despite the 2.9% decline in first quarter GDP. The Federal Reserve has indicated growth in production and spending in the second quarter was strong enough to justify cutting back on its stimulus program. Fed Chairperson Janet Yellen testified to Congress that “significant slack remains in labor markets”, but the unemployment rate fell to 6.1% in June.
In world events, huge portions of Iraq are being overrun by insurgents with a goal of creating a new state that includes parts of war-torn Syria, Israel has marched into Gaza in response to missile attacks, and new sanctions have been imposed on Russia as the conflict in Ukraine shows no signs of peaceful resolution. The human toll has been horrific, but the effect on equity markets has been hard to find.
The global economy is a complex system, and the world’s investment markets respond to a seemingly countless array of ever-changing forces. The expression “A butterfly fluttering its wings on one continent can cause a hurricane halfway around the world” comes to mind. The summer calm of the U.S. stock market could last all year, or be blown away by some bit of data or cascading sequence of world events. We don’t know which butterfly will cause a disaster, and we can’t catch them all, so it’s wise to be prepared in case of a storm.
The cause of the next financial storm may be fluttering around right now, visible only in retrospect – after it’s done its damage. Or it may be months or even years away. But the uncertainty and unpredictability of future events confronts investors today and every day. We believe the importance of an on-going, disciplined risk management process should be weighed carefully by anyone trying to decide whether or not to deliberately expose their portfolio to more risk – and a higher probability of bigger losses – by adopting a more aggressive investment approach. Before making any changes it may be wise to think twice about what adding extra risk to your portfolio really means. After all, you may get what you’re asking for.
Gary E. Stroik is vice president, chief investment officer and lead portfolio manager, of WBI Funds.
The views expressed are those of Gary E. Stroik, and should not be construed as personalized investment advice. All economic and performance information is historical and not indicative of future results. Different types of investments involve varying degrees of risk, and there can be no assurance that the future performance of any specific investment, investment strategy, or product made reference to directly or indirectly in this newsletter, will be profitable, equal any corresponding indicated historical performance level(s), or be suitable for your portfolio. Moreover, you should not assume that any discussion or information provided here serves as the receipt of, or as a substitute for, personalized investment advice from WBI Investments or from any other investment professional. To the extent that you have any questions regarding the applicability of any specific issue discussed to your individual situation, you are encouraged to consult with WBI Investments or the professional advisor of your choosing. All information, including that used to compile charts, is obtained from sources believed to be reliable, but WBI Investments does not guarantee its reliability. Sources for price and index information: Thomson Reuters Baseline and/or Bloomberg (unless otherwise indicated). WBI Investments pays a subscription fee for the use of these investment and research tools. WBI Investments, Thomson Reuters Baseline, and Bloomberg are not affiliated companies. Our current disclosure statement as set forth on Form ADV Part 2 is available for your review upon request. The Dow Jones Industrial Average (DJIA or "The Dow") is a price-weighted average of 30 of the largest blue chip issues traded on the New York Stock Exchange. The S&P 500 Index includes a representative sample of large-cap U.S. companies in leading industries. The NASDAQ Composite Index (NASDAQ) is a market-value weighted index of all common stocks listed on NASDAQ.