
While the start of 2016 has been muted for the U.S. and other developed markets around the world, emerging markets (EM) have rebounded from 2015 and are up 5.69 percent in the first quarter.1 Investors are trying to understand the drivers of this performance and determine if it is sustainable. There are a number of EM barometers that investors should be watching:
Gross Domestic Product (GDP)
The International Monetary Fund (IMF) forecasts an acceleration of growth in emerging markets this year. Specifically, the IMF expects emerging markets to grow 4.3 percent, up from an estimated 4.0 percent in 2015. This would be the first acceleration in growth since 2010. India and parts of emerging Asia are bright spots, projected to grow at a robust pace, whereas Latin America will again see a contraction in 2016, reflecting the recession in Brazil and economic stress elsewhere in the region, even as most other countries in the region will continue to grow. Emerging Europe is expected to grow at a steady pace, albeit with some slowing in 2016, given that Russia could remain in recession in 2016. By contrast, the IMF projects developed markets (DM) to grow by 2.1 percent in 2016, up from an estimated 2.0 percent in 2015.
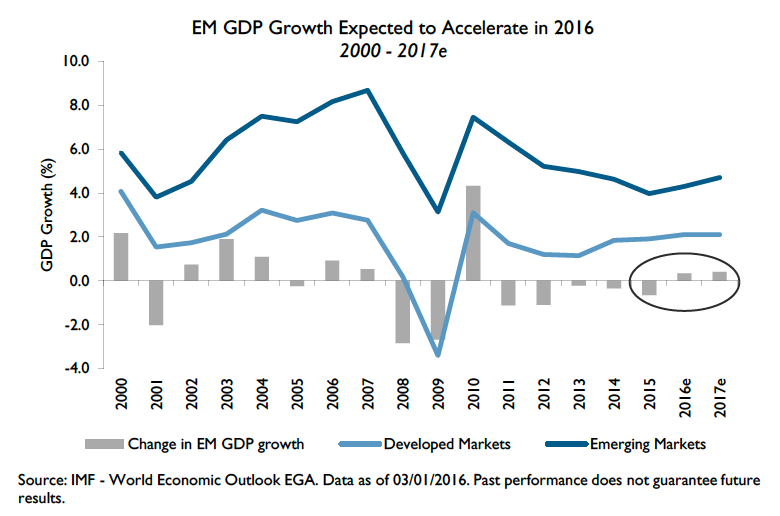
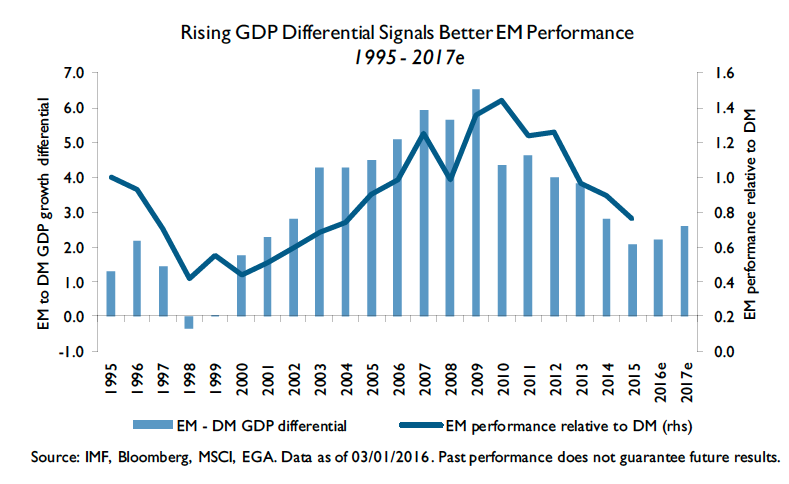
Historically, when EM GDP growth accelerates faster than DM GDP growth (i.e., the EM-to-DM growth differential increases), EM equities usually outperform. With the GDP growth differential expected to rise this year for the first time since 2010, EM equities are well positioned for potential gains.
Fed Tightening
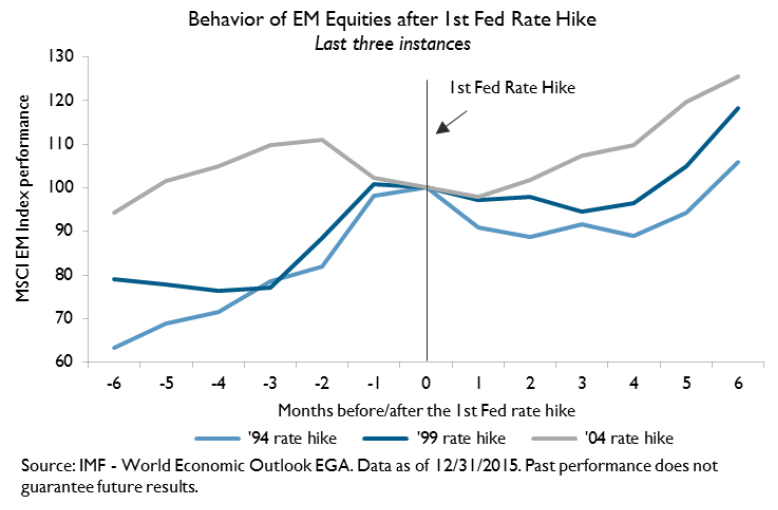
Emerging market equities typically perform well following U.S. Federal Reserve interest-rate hikes. During the last three tightening cycles (’94,’99 and ’04), EM equities on average have been 17 percent higher six months after the first hike in fed funds rates (versus 13 percent for the MSCI EAFE Index and 5 percent for S&P 500 Index). Similarly, six months after the second rate hike, EM returned 25 percent on average (versus 13 percent for EAFE and 5 percent for S&P 500 Index.) This should not be surprising—after all, rising rates signal a return to growth, suggesting rising demand for EM exports.
Consumer Demand
Interestingly, the emerging market consumer has benefited more than the overall EM index when the Fed tightened monetary policy. And as the largest emerging economy, China, transitions from an export-led growth model to one focused on domestic spending, consumer stocks are poised for better performance. Fueled by a growing labor force and middle class, annual consumption in emerging markets is expected to more than double by 2025 to $30 trillion.2 In fact, the size and spending of the emerging-markets middle class is projected to be the dominant driver of global consumption by 2030.3

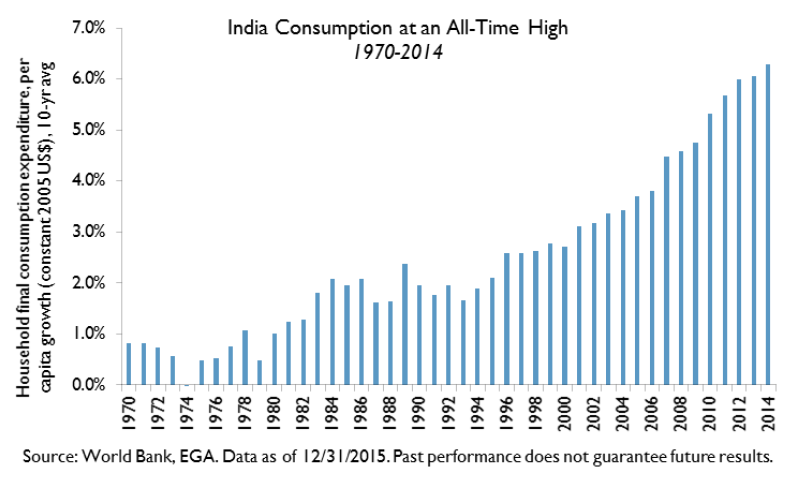
For instance, take a look at India. According to the latest data from the World Bank4, India’s per-capita household consumption expenditures have reached an all-time high of $730 USD (constant 2005 USD). This reflects a growth rate of 84 percent over the past decade. Looking at contributing macroeconomic factors such as median population age, birth rates and per-capita gross domestic product (GDP), our analysis suggests that by 2020 per-capita household consumption expenditures could reach $1,025.
Country Debt
U.S. dollar liabilities of emerging market economies (sovereign, corporate and individual) have been rising steadily over the last 10 years. However, when measured as a percentage of economic output, a very different picture emerges where liabilities appear to be range-bound since 1990, suggesting that U.S. dollar debt concerns are overblown.
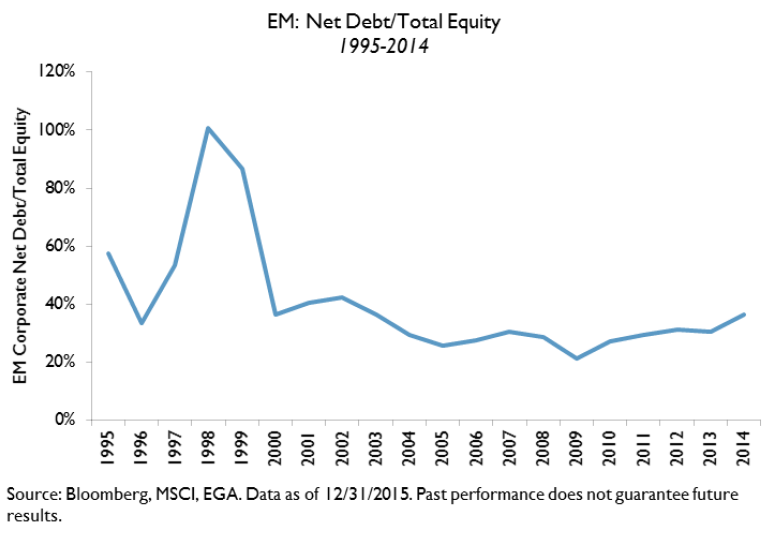
Further, there is no sign of balance sheet stress within EM corporates. Based on EM corporate net-debt-total-equity ratios, EM corporates do not appear to be overleveraged—in fact, the leverage ratio has been in a narrow range since 2000 after substantial deleveraging following the 1997 Asian crisis.
Valuations
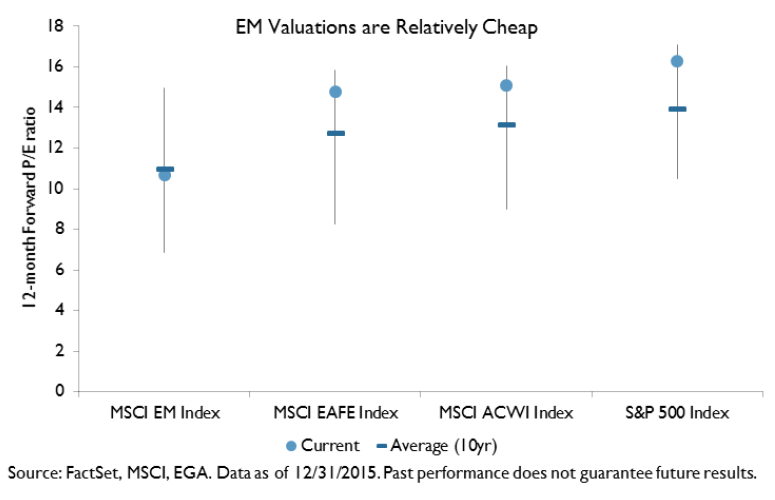
EM equities currently offer attractive valuations relative to other markets as well as their own historical averages. The MSCI EM Index has declined around 35 percent since its 2011 high and now trades at 10.7 times estimated earnings, or almost one-third less than the valuation of the S&P 500. Also, EM currently trades close to its 10-year average P/E ratio, while valuations in other regions are close to their 10-year highs.
Investors looking to refine their asset allocation strategies should keep in mind these fundamental drivers of EM equity performance. In addition to offering potential diversification, emerging market equities could deliver strong performance. Forward-looking investors could be rewarded amid a renewed focus on growth.
Edward Kerschner, CFA, is Vice Chairman and Chief Investment Strategist for Emerging Global Advisors.
Footnotes
1 Bloomberg, MSCI Emerging Markets Index, January 1 – March 31, 2016.
2 Winning The $30 Trillion Decathlon: Going for Gold in Emerging Markets, McKinsey & Co., August 2012
3 The Emerging Middle Class in Developing Countries, Homi Kharas, OECD Development Center, January 2010
4 World Bank, World Development Indicators, October 2015.
Disclosures
Investors should carefully consider the investment objectives, risks, charges and expenses of a Fund before investing. To obtain a prospectus for any EGA or EGShares Funds and other important information, as well as to obtain most recent index performance, please call +1 888 800 4347 or visit emergingglobaladvisors.com to view or download a prospectus. Read the prospectus carefully before investing.
Index returns are for illustrative purposes only and do not represent actual fund performance. Index performance returns do not reflect any management fees, transaction costs or expenses, which could reduce returns. Indexes are unmanaged and one cannot invest directly in an index. Performance data quoted represents past performance. Past performance does not guarantee future results. Current performance data may be higher or lower than actual data quoted. For the most current index performance data please call + 1 888 800 4347.
Emerging market investments involve risk of capital loss from unfavorable fluctuation in currency values, from differences in generally accepted accounting principles, from economic or political instability in other nations or increased volatility, and lower trading volume. The value of an investment denominated in a foreign currency could change significantly as foreign currencies strengthen or weaken relative to the U.S. dollar.
Diversification does not ensure a profit or protect against a loss. ETF shares are bought and sold at market price (not NAV) and are not individually redeemed from the Fund.
Developed Markets (DM) are countries that are most developed in terms of economy and capital markets. They generally have high per capita income or GDP, as well as openness to foreign ownership, ease of capital movement and efficiency of market institutions. Emerging Markets (EM) are countries with less advanced capital markets and less established stock markets than those in developed markets; these countries have embarked on economic development and reform programs as well as begun to open up their markets and emerge. Gross Domestic Product (GDP) a money measure of the goods and services produced within a country's borders over a stated time period. MSCI All Country World (ACWI) Index is an index that captures large and mid-cap representation across 23 developed markets and 23 emerging markets countries. MSCI Europe, Australasia, Far East (EAFE) Index captures large and mid-cap representation across developed markets countries around the world, excluding the U.S. and Canada. MSCI Emerging Markets (EM) Index is an index that is designed to measure the equity market performance in global emerging markets. Price to Earnings Ratio (P/E Ratio) (Forward) is the sum of Bloomberg consensus estimates for the future 12-month earnings of the equity holdings, divided by the total market value of the equity holdings. Both positive and negative earnings are included in the calculation. S&P 500 Index is a broad-based measure of U.S. stock market performance.
The content of this report is presented for general information purposes only. The statements and opinions expressed are those of the author and are as of the date of this report. All information is historical and not indicative of future results, and subject to change. Reader should not assume that an investment in the securities mentioned above was or would be profitable in the future. This information is not a recommendation to buy or sell. While the information and statistical data contained herein are based on sources believed to be reliable, we do not represent that it is accurate and it should not be relied on as such or be the basis for an investment decision. This report may include estimates, projections and other "forward-looking statements". Emerging Global Advisors, LLC assumes no duty to update any such statements. Due to numerous factors, actual events may differ substantially from those presented.
EGA®, EGSharesâ„ and EGAIâ„ are service marks of Emerging Global Advisors, LLC. All other trademarks, service marks or registered trademarks are the property of their respective owners.
Edward Kerschner is a registered representative of ALPS Distributors, Inc. EGA and EGShares Funds are distributed by ALPS Distributors, Inc. Emerging Global Advisors and ALPS are unaffiliated.
EGS002746 | Expires: 4/1/2017