
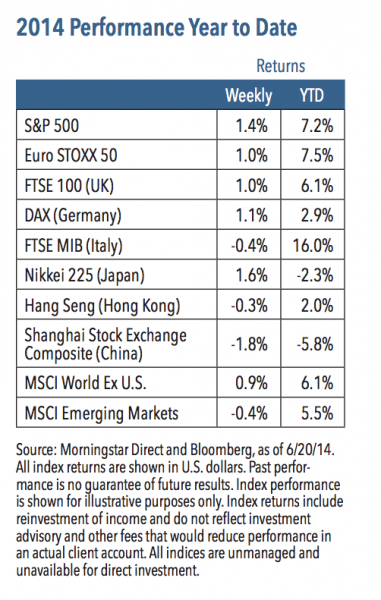
Following a week in which investors took pause and focused on the negatives, they reversed course last week and pushed equity prices higher. A number of factors seemed to contribute to the positive tone, not the least of which was an indication from the Federal Reserve (Fed) that there will be no near-term change to its accommodative monetary policy. In addition, strong manufacturing data, continued merger and acquisition (M&A) activity and a sense that capital expenditure increases may be on the horizon also acted as tailwinds for equities. For the week, the S&P 500 Index rose 1.4%, (1) and surprisingly (given the stronger data), defensive market sectors provided the most leadership. (1)
The Fed May Be Falling Behind the Curve
From our vantage point, economic growth is improving, the labor market is getting healthier and inflation is showing a modest uptick. Yet the Fed does not appear to acknowledge the changing landscape. The statement from the Fed’s policy meeting last week about inflation contained the same language as its April statement. (2) We certainly don’t expect the Fed to change its stance toward monetary policy any time soon, but the Fed may be underestimating the strength of the economy, the pace of jobs growth and, most critically, the possibility of higher inflation.
Weekly Top Themes
- The Fed’s policy meeting went largely as expected. Not much from the Fed’s statement changed other than a slight upward revision to the rates forecast and a modest downward forecast for the economy. Fed Chair Janet Yellen made it clear in her press conference that the Fed remains on course for the time being. (2)
- Manufacturing data continues to look upbeat, with the May Industrial Production (3) and the June Empire State Manufacturing Survey (4) reports both coming out modestly stronger than anticipated.
- Energy supply is increasing while demand is lessening. According to the U.S. Energy Information Administration, U.S. energy production satisfied 84% of domestic demand in 2013, up from a historic low of 69% in 2005. During the same timeframe, U.S. energy use per capita fell about 10%. (5) In other words, rising production is coinciding with increased energy efficiency.
- M&A activity is expanding but still appears to have room to run. The rate of M&A activity peaked in August 2007 (6) before the financial crisis. During the current expansion, M&A activity has grown sharply, but remains below that peak level. (6) To us, this suggests that the pace of mergers and acquisitions will continue to climb for several more years.
- We think capital spending levels will increase. We anticipate the combination of aging capital equipment, rising capacity utilization, strong balance sheets and greater confidence should lead to increased corporate spending.
The Big Picture: Risks Rise, But Stocks Still Look Strong
With equity markets hitting all-time highs, it’s fair to wonder about the risks. We would point to the fact that geopolitical tensions are heating up, with Iraq and Syria potentially deteriorating into terrorist states. Our other areas of concern include the likelihood that interest rates are set to rise and the ongoing need for U.S. fiscal reform. Additionally, the Fed may be minimizing inflation risks, and we expect pressure on the Fed to normalize rates will come at some point. With stocks at their current levels, it seems likely that markets could take a breather to digest recent gains, which may translate into a potential pullback.
However, given our view that the economy is improving, earnings are strong and policy is still accomodative for now, we think the risks of a sustained equity price decline are quite low. Valuations are not as cheap as they were a couple of years ago, but we believe stocks are still more attractive than bonds or cash. The road ahead will likely be more volatile than in recent months, but the backdrop still points to higher equity prices over the long term.
1 Source: Morningstar Direct, as of 6/20/14
2 Source: Federal Reserve http://www.federalreserve.gov/newsevents/press/monetary/20140618a.htm
3 Source: Federal Reserve http://www.federal reserve.gov/releases/g17/current/default.htm
4 Source: Federal Reserve Bank of New York http://www.newyorkfed.org/survey/empire/empiresurvey_overview.html
5 Source: U.S. Energy Information Administration: http://www.eia.gov/totalenergy/data/monthly/
6 Source: Cornerstone Macro, 6/19/14
The S&P 500 Index is a capitalization-weighted index of 500 stocks designed to measure the performance of the broad domestic economy. Euro STOXX 50 Index is Europe’s leading Blue-chip index for the Eurozone and covers 50 stocks from 12 Eurozone countries. FTSE 100 Index is a capitalization-weighted index of the 100 most highly capitalized companies traded on the London Stock Exchange. Deutsche Borse AG German Stock Index (DAX Index) is a total return index of 30 selected German blue chip stocks traded on the Frankfurt Stock Exchange. FTSE MIB Index is an index of the 40 most liquid and capitalized stocks listed on the Borsa Italiana. Nikkei 225 Index is a price-weighted average of 225 top-rated Japanese companies listed in the First Section of the Tokyo Stock Exchange. Hong Kong Hang Seng Index is a free-float capitalization-weighted index of selection of companies from the Stock Exchange of Hong Kong. Shanghai Stock Exchange Composite is a capitalization-weighted index that tracks the daily price performance of all A-shares and B-shares listed on the Shanghai Stock Exchange. The MSCI World Index ex-U.S. is a free float-adjusted market capitalization weighted index that is designed to measure the equity market performance of developed markets minus the United States. The MSCI Emerging Markets Index is a free float-adjusted market capitalization index that is designed to measure equity market performance of emerging markets.
RISKS AND OTHER IMPORTANT CONSIDERATIONS
The views and opinions expressed are for informational and educational purposes only as of the date of writing and may change at any time based on market or other conditions and may not come to pass. This material is not intended to be relied upon as investment advice or recommendations, does not constitute a solicitation to buy or sell securities and should not be considered specific legal, investment or tax advice. The information provided does not take into account the specific objectives, financial situation, or particular needs of any specific person. All investments carry a certain degree of risk and there is no assurance that an investment will provide positive performance over any period of time. Equity investments are subject to market risk or the risk that stocks will decline in response to such factors as adverse company news or industry developments or a general economic decline. Debt or fixed income securities are subject to market risk, credit risk, interest rate risk, call risk, tax risk, political and economic risk, and income risk. As interest rates rise, bond prices fall. Non-investment-grade bonds involve heightened credit risk, liquidity risk, and potential for default. Foreign investing involves additional risks, including currency fluctuation, political and economic instability, lack of liquidity and differing legal and accounting standards. These risks are magnified in emerging markets. Past performance is no guarantee of future results.
Nuveen Asset Management, LLC is a registered investment adviser and an affiliate of Nuveen Investments, Inc.