
After enduring one of the most tumultuous periods of modern US stock market history, investors have gained a renewed interest in strategies aimed at reducing the volatility of their investment portfolios. Traditionally, this has meant increased exposure to bonds along with decreased exposure to stocks. The problem with this strategy today, however, is twofold: first, in many cases bond yields are too low to meet investors’ return objectives; second, after an extended period of low interest rates, many investors have concluded that the risk that rates will rise in the future (sending bond prices lower) is much greater than the likelihood that rates will continue to decline (sending bond prices higher). As a result, an increasing number of investors are considering “alternative” investment strategies in order to potentially decrease risk and enhance risk-adjusted returns in their investment portfolios.
In the past, alternative investment strategies were limited to certain high net worth investors and institutions. Often, these strategies came with relatively high fees and limited liquidity. Today, however, there is a growing number of mutual funds and exchange-traded funds (ETFs) that have opened the door for a broad range of investors to gain exposure to these strategies, generally with lower fees, and in the case of ETFs, with intraday liquidity.
In this newsletter, we will consider one such category of alternative investments known as “managed futures,” which have increased in popularity over the past few decades, and can be accessed via ETFs. We will briefly define what is meant by a “managed futures” strategy, we will evaluate historical levels of risk and returns delivered by these strategies over the past 25 years, and we will consider how and why investors may utilize managed futures ETFs to potentially reduce risk and enhance risk-adjusted returns in an investment portfolio.
What is a Managed Futures Strategy?
Managed futures comprise a wide array of strategies involving both long and short positions in futures contracts, such as commodities, currencies, and equities, aimed at capturing positive returns, regardless of whether the underlying market is advancing or declining. These strategies often employ quantitative, rules-based approaches to accomplish this objective. While some investors may benefit from the addition of managed futures and other alternative investments, these strategies may not be suitable for all investors.
Historical Risk and Rewards of Managed Futures
The underlying futures contracts utilized by managed futures strategies can be highly volatile, with quick and dramatic price fluctuations. In some cases, derivative instruments utilized by these strategies may be less liquid than other types of investments. Attempting to mitigate these risks, many managed futures strategies seek diversification among a variety of futures contracts. For the 25 year period ending on
12/31/12, the standard deviation1 for the Barclay BTOP50 Index was 9.6%, compared to 14.8% for the S&P 500 Index. Even more important than the stand-alone risk of managed futures, in our opinion, has been the potential of these strategies to reduce risk within a diversified investment portfolio. This is primarily due to the low, and often negative, correlations2 between the returns of managed futures and other traditional asset classes, such as stocks and bonds (See Chart 1). Adding assets with low or negative correlations to an investment portfolio may help smooth out returns over time. Diversification does not guarantee a profit or protect against loss.
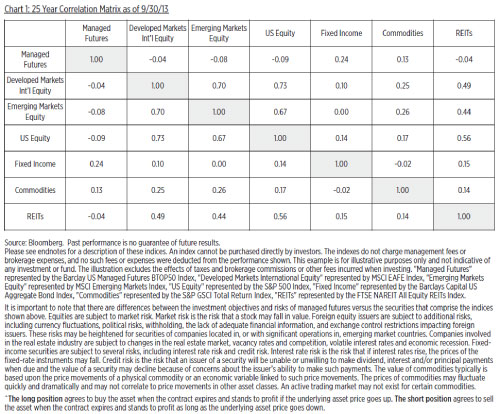
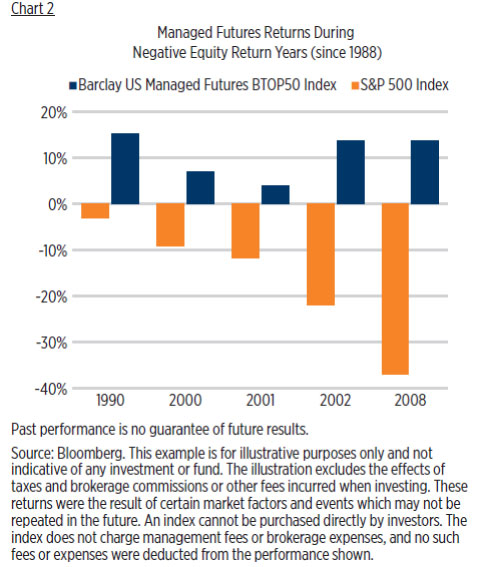
Because of the weak relationship between the returns of managed futures and U.S. stocks (with a -0.09 correlation over the past 25 years), managed futures should not be thought of as a direct “hedge” for stock exposure. However, over the past 25 years, managed futures often fared quite well during periods in which stock market returns were negative. During that stretch, the Barclay BTOP50 Index posted positive returns for each of the five calendar years in which the S&P 500 Index had negative returns (See Chart 2).
Where Do Managed Futures ETFs Fit?
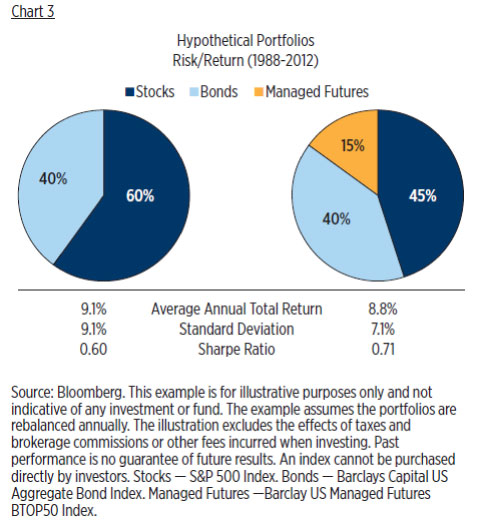
As we have noted, managed futures may be utilized by investors to potentially reduce risk and enhance risk-adjusted returns in an investment portfolio. While every investor is unique in terms of return objectives and constraints, we have prepared an example to demonstrate the impact of incorporating an allocation to managed futures versus a traditional “60% stocks/40% bonds” portfolio allocation (See Chart 3). In this example, 15% is redirected from the portfolio’s equity exposure to managed futures. Of course, varying outlooks on expected future returns from stocks and bonds may alter which asset classes investors choose to reduce when adding managed futures.
In our example in Chart 3, a “45% stocks/40% bonds/15% managed futures” allocation produced a very similar return (8.8% average annual total return) versus a “60% stocks/40% bonds” portfolio (9.1% average annual total return) over the past 25 years. However, risk for the 45/40/15 portfolio (7.1% standard deviation) was about 22% less than a 60/40 portfolio (9.1% standard deviation). As a result, the Sharpe Ratio3 for the 45/40/15 portfolio is .71 compared to .60 for the 60/40 portfolio. In other words, by maintaining a similar level of return, while reducing portfolio risk, the 45/40/15 portfolio provided a better risk-adjusted return than the 60/40 portfolio. There is no assurance these results will be achieved or maintained.
Potential Benefits of Managed Futures ETFs
Managed futures ETFs address many of the critiques that have sometimes been leveled at traditional managed futures accounts. For example: fees for managed futures ETFs are transparent, and generally under 1%, compared to traditional managed futures accounts, which typically charge annual management fees totaling 1-2% of net assets, in addition to annual performance fees, which may be set, for example, at 20% of new profits.4 Moreover, unlike traditional managed futures accounts, managed futures ETFs provide intraday liquidity, with no lock-up periods. Managed futures ETFs do not require hefty minimum investments or investor accreditation. And finally, while traditional managed futures accounts are largely opaque, managed futures ETFs are generally more transparent, allowing investors to better understand what they own and how their funds are being managed.
While most investors still think of ETFs only in terms of traditional asset classes, such as stocks and bonds, a new wave of ETF product innovation is under way, including a number of more sophisticated and complex strategies, such as “liquid alternatives” like managed futures. Although alternative investments carry additional risks, we believe this is a very positive development for ETF investors, many of whom now have access to an entirely new group of tools with which to build more diversified investment portfolios.
You should consider a fund’s investment objectives, risks, and charges and expenses carefully before investing. Contact First Trust Portfolios L.P. at 1-800-621-1675 or visit www.ftportfolios.com to obtain a prospectus or summary prospectus which contains this and other information about a fund. The prospectus or summary prospectus should be read carefully before investing.
ETF Risk Considerations
A fund may not be fully invested at times. Investors buying or selling fund shares on the secondary market may incur customary brokerage commissions. Market prices may differ to some degree from the net asset value of the shares. Investors who sell fund shares may receive less than the share’s net asset value. Shares may be sold throughout the day on the exchange through any brokerage account. However, unlike mutual funds, shares may only be redeemed directly from the fund by authorized participants, in very large creation/redemption units.
A fund’s shares will change in value and you could lose money by investing in a fund. The trading prices of commodities futures and other instruments fluctuate in response to a variety of factors. A fund’s net asset value and market price may fluctuate significantly in response to these factors. As a result, an investor could lose money over short or long periods of time. Funds which employ a short selling strategy may experience increased volatility and greater gains or loses.
Definitions
The Barclay US Managed Futures BTOP50 Index seeks to replicate the overall composition of the managed futures industry with regard to trading style and overall market exposure. The MSCI EAFE Index measures international equity performance. It comprises the MSCI country indices that represent developed markets outside of North America: Europe, Australasia and the Far East. The MSCI Emerging Markets Index is a free float-adjusted market capitalization index that is designed to measure equity market performance of emerging markets. The S&P 500 Index is an unmanaged index of 500 stocks used to measure large-cap U.S. stock market performance. The Barclays Capital U.S. Aggregate Bond Index covers the investment-grade, U.S. dollardenominated, fixed-rate taxable bond market, including Treasuries, government-related and corporate securities, MBS (agency fixed-rate and hybrid ARM pass throughs), ABS, and CMBS. The S&P GSCI Total Return Index is used to measure general commodity price movements and inflation in the world economy. The index is calculated primarily on a world production weighted basis, comprised of the principal physical commodities futures contracts. The FTSE NAREIT All Equity REITs Index contains all tax-qualified REITs with more than 50 percent of total assets in qualifying real estate assets other than mortgages secured by real property that also meet minimum size and liquidity criteria.
This material is not intended to be relied upon as investment advice or recommendations. ¹Standard deviation is a measure of risk based on the volatility of historical returns. 2Correlation measures the degree to which the prices of two assets move together, ranging between -1 and +1. A correlation of +1 indicates perfect co-movement between two assets, while a correlation of -1 indicates a perfectly inverse relationship between two assets. A correlation of 0 indicates no relationship between the prices of two assets. 3Sharpe Ratio is a measurement excess reward per unit of risk. 4Source: Bloomberg and Wells Fargo Advisors.
Not FDIC Insured • Not Bank Guaranteed • May Lose Value ETFNEWSL111