
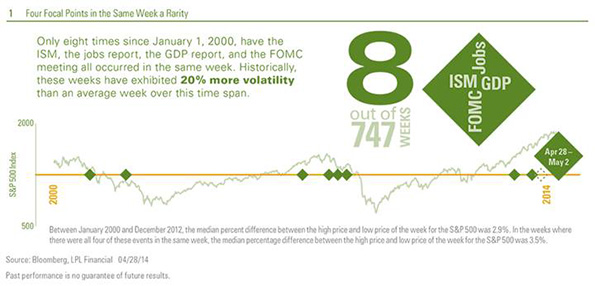
Eight times per year, the outcome of the Federal Reserve’s (Fed) Federal Open Market Committee (FOMC) meeting becomes the focal point for market participants. Four times each year, the first look at the health of the economy in the prior quarter from the Bureau of Economic Analysis’s (BEA) report on gross domestic product (GDP), dominates the headlines. Similarly, at the start of each month, the Report on Business from the Institute for Supply Management (ISM) and the monthly labor market report from the U.S. Department of Labor are the centerpieces of any trading week. This week (April 28 - May 2, 2014), all four of these key events are on the docket. How rare is this? In the 747 weeks between January 1, 2000, and April 28, 2014 (over 14 years), all four of these often market-moving events have occurred in the same week just eight times, most recently in the last week of July of 2013.
As an aside, all four would have also occurred the week of October 28 through November 1, 2013, but the 16-day shutdown of the U.S. government prevented the release of the Q3 2013 GDP and the October 2013 Employment Situation reports that week.
Historically, these weeks have exhibited 20 percent more volatility than an average week over this time span [Figure 1], and the VIX, a measure of equity market volatility, has been 4 percent higher. Add in the 139 S&P 500 companies expected to report earnings, and this week is unlikely to be just another boring mid-spring week for financial market participants.
In addition to those four key events, markets will digest U.S. vehicle sales for April, pending home sales for March, home prices for February, and key data in China (Purchasing Managers' Index [PMI] for April) and Japan (housing starts and vehicle sales for April), along with the Bank of Japan’s monetary policy meeting.
FOMC in Focus:
Tuesday, April 29 & Wednesday, April 30, 2014
- This is the third of eight FOMC meetings this year.
- We continue to expect the Fed to trim its bond purchases -- also known as quantitative easing (QE) -- by $10 billion per month this year, and to remain on pace to exit quantitative easing by the end of 2014.
- We expect that the Fed will maintain its promise to keep rates low for a “considerable time” after the QE program ends.
- This meeting will not include a press conference from Fed Chair Janet Yellen, and the FOMC will not be releasing a new economic forecast at the conclusion of this meeting. In recent years, markets have been conditioned not to expect many changes to Fed policy at FOMC meetings that do not include press conferences and new forecasts from the FOMC.
- The GDP report for the first quarter of 2014 will be released on Wednesday, the second day of the Fed’s meeting. The report will likely show that the economy barely expanded in the quarter, due in part to severe winter weather in much of the nation. The FOMC will likely acknowledge this in the statement.
Q1 GDP in Focus:
Wednesday, April 30, 2014
- The consensus of economists (as measured by Bloomberg News) is looking for a very modest 1.2% annualized increase in real GDP for the first quarter of 2014. Estimates have moved sharply lower since the start of 2014, thanks to the much more severe than usual winter weather that impacted the nation during the quarter. At the start of 2014, the consensus estimate for Q1 2014 real GDP growth was 2.6%.
- Consumer spending, housing (residential investment), and business investment in structures are likely to bear the brunt of the poor weather.
- Government spending, which has been a drag on GDP growth in all but four quarters during the past four years, should be a plus for GDP in the first quarter as federal government spending rebounds after the government shutdown reduced spending in the fourth quarter of 2013.
- As noted in our Outlook 2014: The Investors Almanac, we expect that U.S. economic growth may accelerate to about 3.0% in 2014, after growing at less than 2.0% in 2013. Growth in 2013 was stifled by tax increases and spending cuts that added a material drag to the economy. That drag fading, as well as solid business and consumer spending, should help to boost GDP this year.
April ISM in Focus:
Thursday, May 1, 2014
- The consensus forecast (as measured by Bloomberg News) is looking for a 54.3 reading on the ISM for April 2014, after the 53.7 reading in March 2014.
- A reading above 50 on the ISM indicates that the manufacturing sector is expanding; a reading below 50 on the ISM indicates that the manufacturing sector is contracting, and an ISM reading at 42 or below indicates that the overall economy is in recession.
- The Markit PMI -- released several weeks ahead of the ISM report -- has been gaining acceptance among market participants as a good proxy for the ISM report, and may, over time, diminish the importance to the markets of the ISM report. The Markit PMI reading for April 2014 was solid (55.4), but below the March 2014 reading (55.5) and also below consensus (56.0).
- Over the course of 2014, we continue to expect the manufacturing sector will likely be boosted by the “onshoring” of jobs, the U.S. energy renaissance, which has brought relatively cheap and plentiful supplies of energy, and an improving pace of capital spending. At the same time, weakness in China and in other key emerging markets -- a key destination for our manufactured goods -- may continue to drag on the manufacturing sector in 2014.
April Employment Report in Focus:
Friday, May 2, 2014
- The economist consensus (as measured by Bloomberg News) is that that the U.S. economy created a net 215,000 new jobs in April 2014. After the economy created about 200,000 jobs per month in the 12 months ending in November 2013, severe winter weather in many parts of the nation led to a slowdown in job creation during the winter of 2013 - 14, when an average of just 154,000 jobs per month were created. This figure is derived from a survey of business establishments.
- The consensus of economists’ forecasts suggests the unemployment rate (measured from a survey of households) may tick down to 6.6% in April 2014 from 6.7% in March 2014. The labor force participation rate (the percentage of the population over 16 that has a job or is looking for work) is the wild card here. The overall participation rate plateaued in the 1990s, peaked at just over 67% in the early 2000s, and has been falling ever since (see Weekly Economic Commentary: Labor Market Report Card, dated March 31, 2014 for more details).
- The shift in weather from a colder, snowier than usual winter to a more normal weather pattern in April should lead to a rebound in weather-sensitive areas of employment, like retail, leisure and hospitality, food services, and recreation.
- Our view is that the return of more normal weather and the expected reacceleration of the U.S. economy should allow the labor market to routinely create 200,000 to 250,000 jobs per month and push the unemployment rate lower in the period ahead. But other measures of the health of the labor market -- hiring rates, the quit rate, and the unemployment rate -- still show that the labor market is not yet back to normal.
IMPORTANT DISCLOSURES
The opinions voiced in this material are for general information only and are not intended to provide specific advice or recommendations for any individual. To determine which investment(s) may be appropriate for you, consult your financial advisor prior to investing. All performance reference is historical and is no guarantee of future results. All indices are unmanaged and cannot be invested into directly.
Gross domestic product (GDP) is the monetary value of all the finished goods and services produced within a country’s borders in a specific time period, though GDP is usually calculated on an annual basis. It includes all of private and public consumption, government outlays, investments and exports less imports that occur within a defined territory.
The Federal Open Market Committee (FOMC), a committee within the Federal Reserve System, is charged under the United States law with overseeing the nation’s open market operations (i.e., the Fed’s buying and selling of United States Treasure securities).
Quantitative easing is a government monetary policy occasionally used to increase the money supply by buying government securities or other securities from the market. Quantitative easing increases the money supply by flooding financial institutions with capital in an effort to promote increased lending and liquidity.
Purchasing Managers' Index (PMI) is an indicator of the economic health of the manufacturing sector. The PMI index is based on five major indicators: new orders, inventory levels, production, supplier deliveries and the employment environment.
The Standard & Poor’s 500 Index is a capitalization-weighted index of 500 stocks designed to measure performance of the broad domestic economy through changes in the aggregate market value of 500 stocks representing all major industries.
The Institute for Supply Management (ISM) index is based on surveys of more than 300 manufacturing firms by the Institute of Supply Management. The ISM Manufacturing Index monitors employment, production inventories, new orders, and supplier deliveries. A composite diffusion index is created that monitors conditions in national manufacturing based on the data from these surveys.
Markit is a leading, global financial information services company that provides independent data, valuations and trade processing across all asset classes in order to enhance transparency, reduce risk and improve operational efficiency. The Markit Purchasing Managers' IndexT (PMIT) is a composite index based on five of the individual indexes with the following weights: New Orders - 0.3, Output - 0.25, Employment - 0.2, Suppliers' Delivery Times - 0.15, Stocks of Items Purchased - 0.1, with the Delivery Times Index inverted so that it moves in a comparable direction.
This research material has been prepared by LPL Financial.
To the extent you are receiving investment advice from a separately registered independent investment advisor, please note that LPL Financial is not an affiliate of and makes no representation with respect to such entity.
Not FDIC or NCUA/NCUSIF Insured | No Bank or Credit Union Guarantee | May Lose Value | Not Guaranteed by any Government Agency | Not a Bank/Credit Union Deposit
Tracking # 1-268074 (Exp. 04/15)
John Canally is an Economist and Investment Strategist for LPL Financial.