
One of my favorite holiday traditions is revisiting the 1983 film Trading Places. What? You didn’t know it was a Christmas movie? For a month, I happily lift a line from Eddie Murphy’s character, Nenge Mboko, when I loudly announce “Merry New Year” while greeting friends, family and (poor startled things) strangers.
And it looks like it will indeed be a merry new year ahead, at least according to the sentiment embedded in some exchange-traded fund (ETF) charts.
Let’s look at one in particular – that of the SPY-OEF spread. The SPDR S&P 500 Trust (NYSE Arca: SPY) is the granddaddy of equity ETFs and reflects a broad swath of large domestically traded stocks. The S&P 500 is often referred to as the “blue chip index.” The bluest of its blue chips – its megacaps mostly – are tracked by the iShares S&P 100 ETF (NYSE Arca: OEF). OEF is the fund you’d put your grandmother into. Though it naturally follows the same general trajectory as SPY, it travels on smoother pavement. OEF’s standard deviation is just half of SPY’s. OEF is a more defensive way to play the stock market.
OEF also trades at about half of SPY’s price. Right now, the price spread is about $125 a share. T’wasn’t always so, as you can see from the chart below.
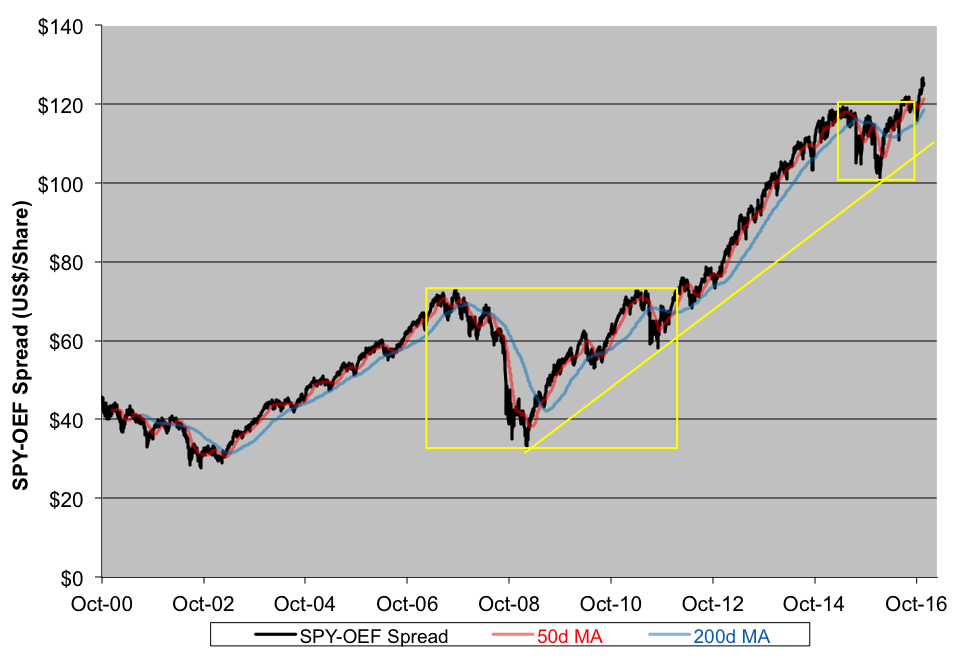
The size of the spread tends to shrink and expand along with investors’ fears. When punters feel ebullient about the economy, they tend to pile into SPY, widening the spread. When fearful, investors prefer OEF’s relative safety and the spread, as a consequence, narrows. You can see two areas boxed in the chart when the spread narrowed significantly. Here’s the thing: the spread is a leading indicator of trouble ahead. Both the financial crisis of 2008 and the half-year stock market swoon that ended in early 2016 were presaged by a narrowing spread.
But see the spread now? It’s on the rise again. Optimism prevails. So much so, in fact, that the S&P 500 seems likely to exceed the 2,500 level (it’s now dancing above 2,200). That puts SPY on track to touch $254 or so, up from its present altitude of $225. And OEF? Technically, it’s set for another 10 percent boost to the $110 level. And that means our humble little spread has a chance to hit $144.
Not next week, but in the near future. There’s still some work to be done around the $128 level first, but in any event, it looks I’m gonna need to expand that chart on the upside before too long.
“Merry New Year!”