
The sharply flattening yield curve is an everyday talking point among those following interest rates.
For context, in the space of two weeks, 2s/10s has narrowed just over 16 basis points. Okay, so what’s going on? First and foremost, it’s inflation. As much as the Fed has talked about its 2 percent target and transitory factors, inflation here and elsewhere is dragging. Euro Zone Consumer Price Index topped at 2 percent earlier this year but has slid to 1.4 percent. And I see measures of core Canadian inflation ranging from 1.3 percent to 0.8 percent, and they just hiked. Here in the U.S., we just saw core Personal Consumption Expenditures at 1.3 percent and headline at 1.6 percent; not such a worry. Need I mention the flat Average Hourly Earnings in October and up in real terms barely 0.2 percent year-over-year?
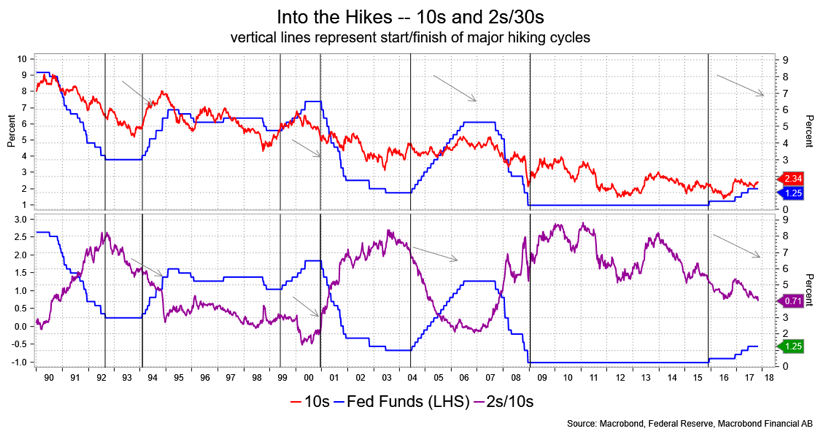
Also, the Fed is hiking and reducing their balance sheet. History shows that tightening policy correlates well with both a flatter curve and steadyish to lower long-term rates. We’ve never seen the Fed hiking when inflation has been so tame.
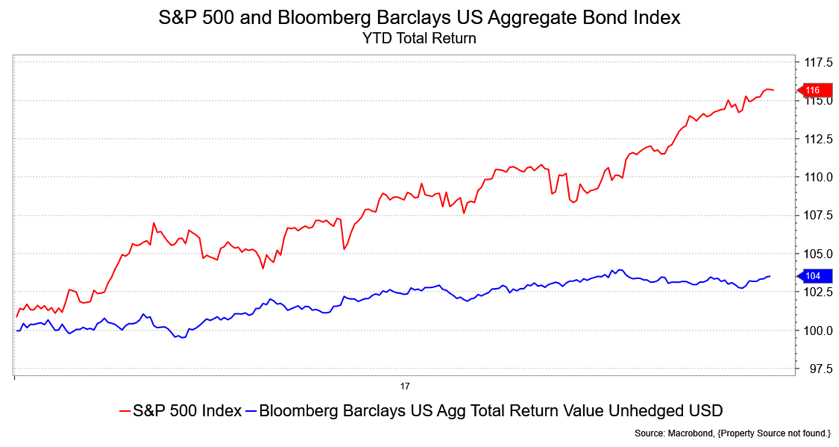
This latter pair seem to be strategic in nature and are, I think, the main story. Why now, though? Why so recently? Well, there is the position thing—a squeeze. There’s also the allocation angle. The S&P 500 has returned 16 percent year to date. The Bloomberg Aggregate Bond Index has returned 3.5 percent. So here we are in November and perhaps asset rebalancing is going on, certainly anticipated, and that would favor bonds vs. stocks in a balanced portfolio. Has anyone suggested that stocks look frothy? The talk is all there and prudent if gentle rebalancing when the longer end of the bond market is in a short-term oversold condition could have exaggerated the curve impact, all things being equal. For public pensions funds especially, a shift to long bonds and locking in equity gains makes sense and is something we’ve seen before.
Maybe there’s also a bit of skepticism about the tax plan. This gets back to the dreary details ranging from how much the middle class will get vs. the rich, how much it might contribute to the deficit, the various deductions that might go away or be whittled down and, yes, the Democratic wins in the recent elections. Much like Fed Fund futures project, a lot has been priced in, which leaves less room for enthusiasm when the full details are known. Also, recognize the international angle. The Fed’s balance sheet is $4.22 billion, but add the European Central Bank, Bank of England and Bank of Japan together and you have $10.3 trillion—U.S. rates are suddenly rather more compelling.
The Treasury market may be sniffing out a slowdown but forgot to tell the equity market about it.
It’s way too early to suggest this is about a recession. The 2s/10s curve at current levels is more consistent with mid-cycle levels than an imminent recession. Roughly, these sorts of levels precede an inversion by about 18 months.
David Ader is Chief Macro Strategist for Informa Financial Intelligence.