
I must admit I was more than a little surprised to see a utility portfolio show up on my screen of April’s best-performing ETFs. After weeding out the leveraged and inverse products as well as ETNs (who needs the credit risk?) there it was: the PowerShares S&P SmallCap Utilities Portfolio (Nasdaq: PSCU).
By any light (yes, the pun was intended) PSCU had a pretty good month. Its 6.4 percent gain brought the fund’s one-year return to 13.9 percent. Utilities aren’t supposed to make gains like that. Outsized gains aren’t unusual for small-cap stocks, though.
And make no mistake, the stocks inside the PSCU portfolio are indeed small. There are only 16 of them, all culled from the S&P SmallCap 600 Index. About 38 percent are actually classified as micro-caps.
PSCU is small in another way. Its asset base is just $58 million. Compare that to the Utilties Select Sector SPDR (NYSE Arca: XLU), a 28-stock index tracker with nearly $7.5 billion under management. XLU draws its components from the S&P 500 Index.
XLU and PSCU are separated by more than just market capitalization. XLU components are traditional utilities, so to speak. They’re gas and electric companies, independent power producers and energy traders. PSCU’s portfolio also holds traditional utilities but includes communications companies doing business in landline, wireless, satellite and cable media. Telecoms make up 38 percent of the PSCU portfolio.
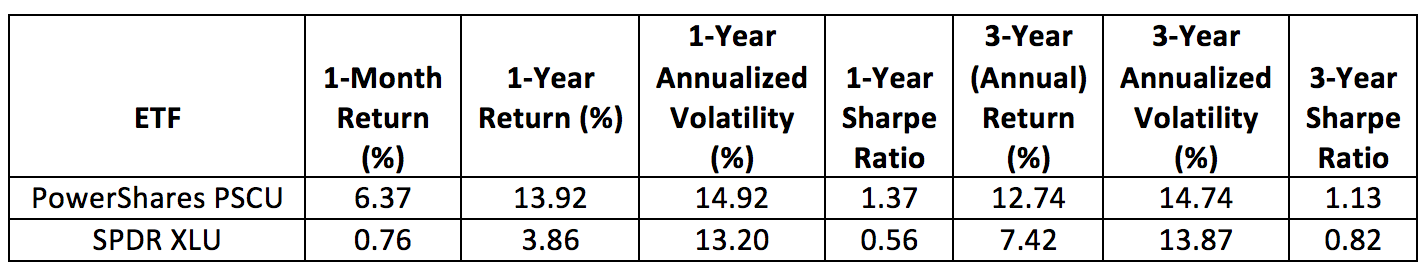
So there’s the reason for the outperformance. And it wasn’t just in April that the PowerShares portfolio bested its competition. Take a look at the numbers.
Growth of 10,000

PSCU outgunned the large-cap XLU over one-year and three-year horizons as well. And it’s not just the gains that make PSCU so interesting. It’s also the fund’s volatility. Or relative lack of volatility. Yes, the small-cap fund’s standard deviation is higher than XLU’s, but marginally so. With its meatier gains, PSCU earns consistently better risk-adjusted returns.
Look at the chart showing the growth of a $10,000 investment. Both funds have suffered notable drawdowns. XLU’s worst was a 12.7 percent hit between February and June 2015. It took until March 2016 for the fund to recover the loss. The biggest loss suffered by PSCU was 7.9 percent between July and August 2016. That loss was wiped out by December. This stuff is important for utility-minded investors who tend to be risk averse.
The primary reason most folk invest in utilities, however, is income. XLU yields 3.3 percent currently. PSCU is not far behind with its 2.9 percent rate.
There’s another reason why utilities are added to portfolios: diversification. XLU’s correlation to the broad market is lowly at 0.16. PSCU’s coefficient is higher—0.42 over three years—but still low enough to dampen some market risk.
After this discovery, I can hardly wait to check my screen for this month’s best-performing ETFs. There’s bound to be some more surprising finds.
Brad Zigler is REP./WealthManagement's Alternative Investments Editor. Previously, he was the head of Marketing, Research and Education for the Pacific Exchange's (now NYSE Arca) option market and the iShares complex of exchange traded funds.