
Maybe you have to be of a certain age to know how to get the “TILT” fault to appear on an old-fashioned pinball machine. You can, however, tilt your portfolio no matter how old you are.
By tilt, I mean overweighting an investment style within a total portfolio. You can, for example, tilt toward small-cap stocks or value stocks simply by allocating portfolio space to any exchange traded funds (ETFs) focused on those styles. Long before smart beta became fashionable, style ETFs offered investors and advisors opportunities to earn higher risk-adjusted returns than the market with relatively modest incremental costs.
But which of these style funds is best for your portfolio?
Seminal research by Eugene Fama and Kenneth French form the basis for many advisors’ recommendations to tilt a portfolio toward small-cap or value stocks. However, the advent of style ETFs revealed that blind adherence to this dictum might not produce optimum results.
Rubber Meets the Road
The granddaddies of style ETFs are in the iShares line, which debuted in 2000, and include value and growth tilts on the S&P 500, the S&P Mid-Cap 400 and the S&P Small-Cap 600 indices. If we measure each of these nine ETFs by alpha over several discrete time frames, we actually find the most positive results were produced by the mid-cap value fund, not the small-cap value portfolio.
Overall, when clocked against the Vanguard Total Stock Market ETF (NYSE Arca: VTI), the iShares complex produced positive alpha in just 37 percent of instances over one-, three-, five-, 10- and 15-year time periods. Topmost was the iShares S&P Mid-Cap 400 Value ETF (NYSE Arca: IJJ), cranking out positive alpha in four (80 percent) of five time frames, most importantly in the 15-year span. Three funds – the iShares Core S&P 500 ETF (NYSE Arca: IVV), the iShares S&P 500 Value ETF (NYSE Arca: IVE) and the iShares S&P Small-Cap 600 Value ETF (NYSE Arca: IJS) – put a plus sign in front of their alpha readings in three (60 percent) of five cycles.
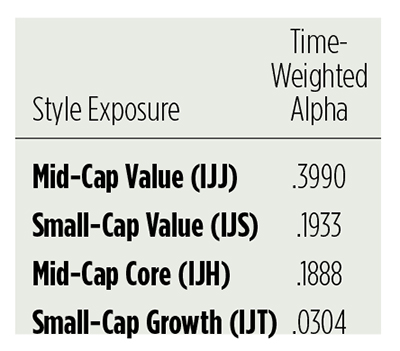
Whether a style tilt is worthwhile depends not only on the frequency of a positive alpha reading, but also on the size of the coefficient. To determine the best tilt, we need to weight the funds’ alpha readings by time, making the longer-term values heftier. After all, portfolios – especially retirement portfolios – are meant to endure, right?
When we do that, the S&P 500 fund drops out because its three positive alpha values are all recent. As IVV recedes from view, the iShares Core S&P Mid-Cap 400 (NYSE Arca: IJH) rises because of its high alpha over the 15-year period. So, too, for the iShares S&P Small-Cap 600 Growth ETF (NYSE Arca: IJT). That gives us four funds for further examination:
You’re more likely to use style funds successfully to augment, rather than supplant, a core market exposure. Why? Because tilts increase tracking error versus the total market. That’s a good thing when the style’s in favor, but not so good when large-cap growth (the bias embedded in a capitalization-weighted total market index) is dominant.
There can be long periods of underperformance for a tilted portfolio. You can see an example of this illustrated in Chart 1 showing the alpha trajectory of the IJH portfolio. IJH Investors had to wait more than a decade for IJH’s positive alpha to emerge.
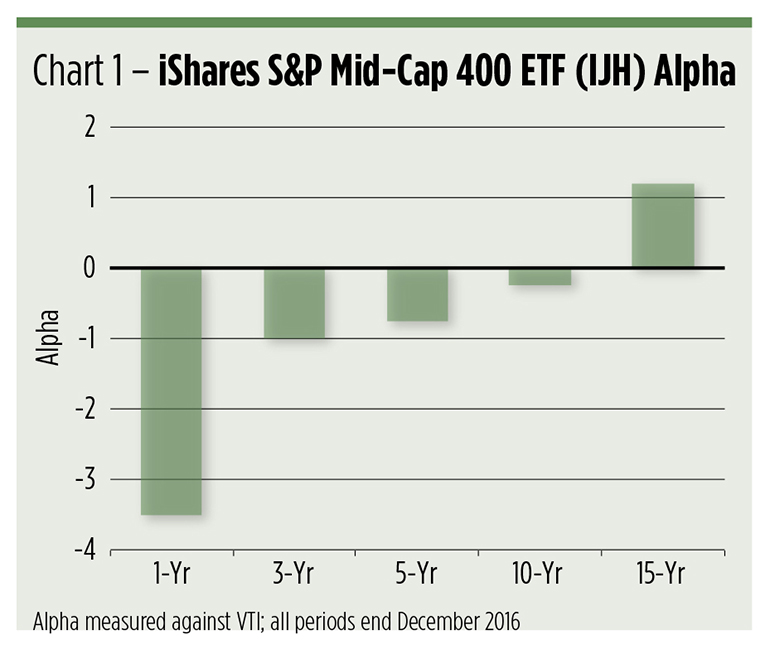
Who besides the Wizard of Omaha has the patience to wait that long? Clearly, the investment horizon is an important consideration for tilt-minded advisors and investors. Impetuous investors are likely to bail after just a few years of underperformance. By doing so, they foreclose the opportunity to ultimately come out on top.
How Much Tilt?
If you shouldn’t replace total equity market exposure with a style fund, just how much space should you carve out for a tilt?
In great part, the answer depends on costs. The holding cost of a style ETF, though low compared to a similar mutual fund, is still a multiple of that for a total market proxy like Vanguard’s VTI. VTI can be held for an annual expense of just five basis points (.05 percent); the iShares IJS portfolio costs five times as much. So allocating, say, 25 percent of your domestic market exposure to a small-cap value overweight doubles your overall holding cost. Costs impact expected returns. The higher the cost of a portfolio, the greater the gross return required to outperform the market.
And if we actually used a 25 percent allocation? Which of our four alpha producers would have done best by investors? Would Fama and French be proven right?
In the long run – that is, for the five-, 10- and 15-year time spans – a small-cap overweight did indeed improve returns. But it wasn’t the value tilt that did best; it was growth. The winning adjunct was the iShares IJT fund (see Chart 2).
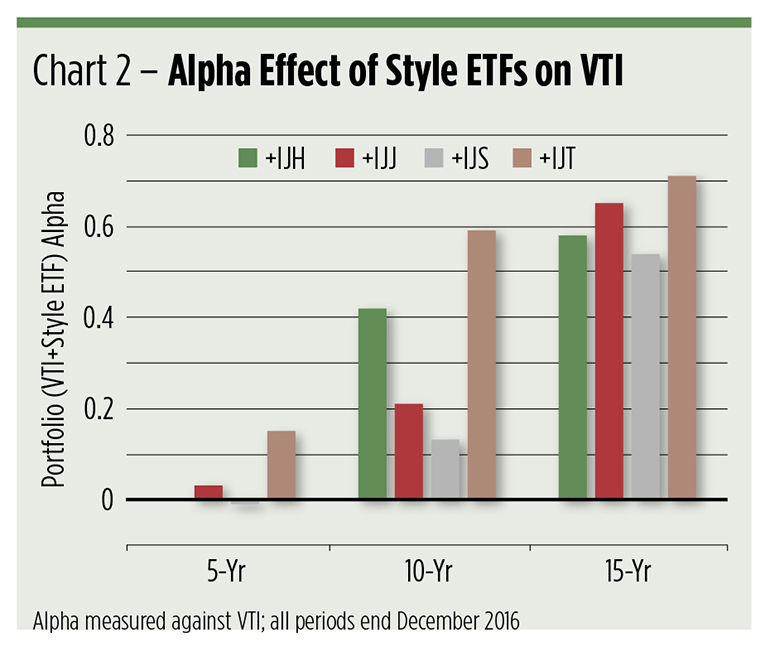
So what happened to the Fama and French model? Why wasn’t the IJS small-cap value fund the better overweight? Largely, it’s a timing artifact. Fama and French used a data set going back to 1926. Our style ETFs have a much shorter lifespan. Small-cap value may have outperformed over 90 years, but more recently, growth has been on a roll. At least up until now.
From the depths of the 2008-2009 recession, growth stocks outpaced their value peers. You can see that cycle playing out in the chart above. The greatest alpha contribution for growth has been in the 15-year period, but as you move rightward – getting closer to the present day – the alpha contribution shrinks. This waning influence may signal an approaching cycle top for growth and a reversion to the Fama and French norm.
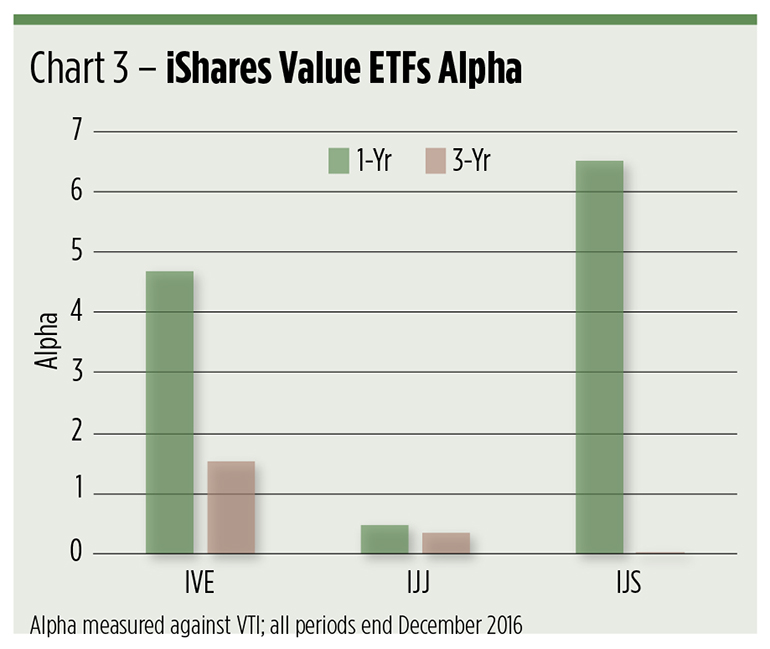
If you look at more recent discrete time frames, it seems that notion is confirmed. Over the past year, the small-cap value IJS fund earned a 6.57 alpha coefficient, the highest risk-adjusted metric in the nine-fund style complex. The value premium, in fact, emerged across all capitalization tiers during 2016. The iShares S&P 500 Value ETF (NYSE: IVE) punched a 4.69 alpha ticket while the mid-cap value IJJ portfolio printed a 0.49 coefficient.
The Takeaway
Markets are cyclical, so anytime a metric – whether it’s gross returns or alpha – is at a historic extreme or far beyond average, you’ve got to start thinking of mean reversion. You should also be aware of style seasonality. By that, I don’t mean that you should watch a calendar, but rather keep in mind the words of Chance the Gardener: “Growth has its seasons.”
Growth stocks tend to fare well in a low-interest rate environment, fueled by improvements in corporate earnings. Put simply, growth leads bull markets. Value stocks, on the other hand, are the leading edge of economic cycles and tend to do well early in recovery phases. The corollary is that value tends to underperform late in a cycle.
You can take your timing cues here if you like, but the better takeaway is this: Because growth and value tend to move countercyclically, it generally pays to maintain exposure to both. Capitalization-weighted portfolios, such as VTI, structurally tilt toward growth, so a countervailing allocation to a value portfolio is needed.
As we’ve seen, value has the ability to bounce back strongly after periods of relative underperformance. You wouldn’t want to miss alpha hauls like that, would you?
Brad Zigler is REP./WealthManagement's Alternative Investments Editor. Previously, he was the head of Marketing, Research and Education for the Pacific Exchange's (now NYSE Arca) option market and the iShares complex of exchange traded funds.