
February’s market break caught many investors by surprise. Many who thought they had girded their portfolios against volatility were shocked by the size of their losses. “Where’s my protection?” was an oft-heard complaint.
Most of the grumbling seemed to arise from confusion about so-called “low-volatility” products.
The Low-Vol Anomaly
First of all, low-volatility, or “low-vol,” funds aren’t designed to be hedges against sudden market breaks. They’re instead constructed to exploit a phenomenon known as the “low-volatility anomaly.”
Most investors, as well as many advisors steeped in the Capital Asset Pricing Model, suppose a positive relationship between risk and return. CAPM would have us believe that we’ll be rewarded with higher returns when we invest in higher-risk (read: high-volatility or high-beta) issues.
But empirical research conducted over the past five decades seems to belie this notion. In fact, low-vol stocks have been found to deliver higher risk-adjusted returns and alpha than most high-vol paper. That’s the anomaly.
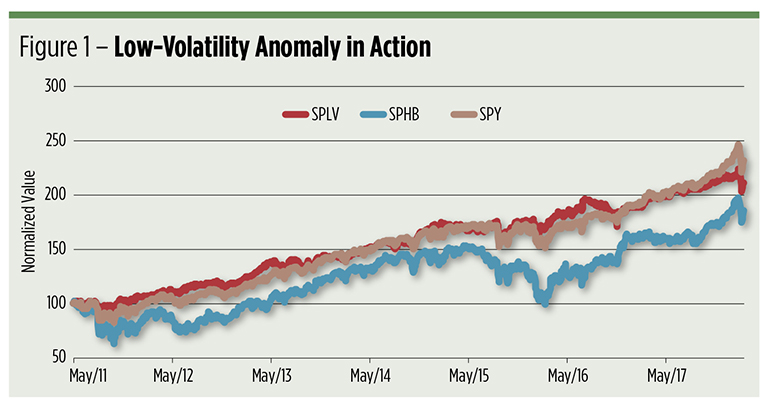
You can see this incongruity in action by comparing the performance of the PowerShares S&P 500 Low Volatility ETF (NYSE Arca: SPLV) and its opposite number, the PowerShares S&P 500 High Beta ETF (NYSE Arca: SPHB). Each fund carves out 100 stocks from opposite ends of the volatility spectrum within the S&P 500 Index. SPLV selects stocks with the lowest daily standard deviation over the past year while SPHB grabs those issues with the highest beta coefficients.
As Figure 1 illustrates, the low-vol slice of the S&P 500 has clearly outperformed the high-beta portion over time. But look at the relationship between SPLV and the SPDR S&P 500 ETF (NYSE Arca: SPY). SPY proxies SPLV’s parent index. Sometimes SPLV fares better than SPY and at other times, SPY excels. The run-up to the February 2018 break was, in fact, led by SPY’s outperformance. Muting volatility can sometimes dampen fluctuations on the upside as well as the downside.
The bottom line for low-vol products is simple: If you give up less ground in market downturns, you have less work to do to reach or exceed breakeven on a subsequent rebound. A 10 percent drop, for example, requires an 11 percent climb to break even; a rebound of 25 percent is needed to wipe out the effect of a 20 percent decline. To put it into a tagline: Low-vol investors hope to win by losing less.
The Low-Vol Factor
Each low-vol product attempts to exploit the anomaly in a unique fashion, and as a result, they often produce disparate outcomes. We’ve seen SPLV’s rather straightforward approach in action, but there are two other seasoned exchange traded funds in direct competition to the PowerShares products.
The youngest, first floated in September 2016, is the Fidelity Low Volatility Factor ETF (NYSE Arca: FDLO) which plumbs the 1,000 largest U.S. stocks for components with an ideal combination of low return volatility, low beta and low earnings volatility. FDLO’s methodology puts 125 to 130 issues in the portfolio.
The SPDR SSGA US Large Cap Low Volatility Index ETF (NYSE Arca: LGLV) also uses a 1,000-stock universe. LGLV’s practice aims for constituents with low exposure to momentum and beta, ultimately passing through about 150 stocks to its portfolio.
The dissimilar screens employed by the three low-vol ETFs have produced portfolios with distinctive characteristics. Oh, they all end up with similar sector concentrations—currently heavy in financials, industrials and technology—but have diverse exposures to the low-vol factor. If you’re a purist—and many portfolio runners are these days—you’d want maximum exposure to the low-vol factor and little else in this allocation.
For low-vol ETFs, it turns out that simpler is better. Figure 2 shows the uncomplicated approach to volatility screening used by SPLV that pays off with nearly pure exposure to the low-vol factor. The other ETFs offer a mix of factors.
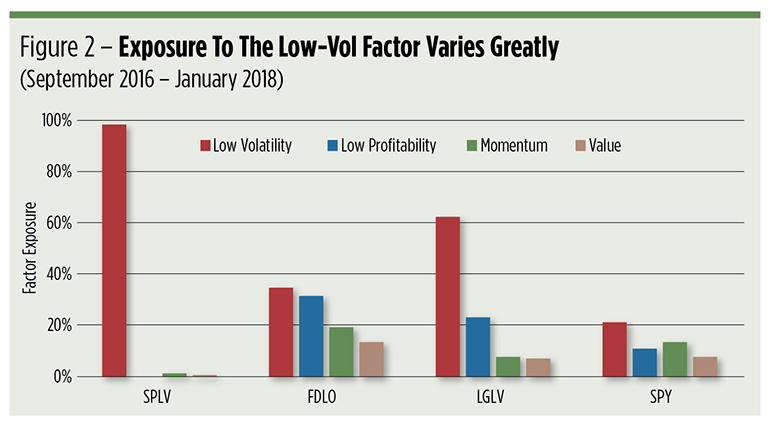
There’s a price for SPLV’s factor purity. Its return has lagged those of the other large-cap, low-vol ETFs recently. Since its 2016 inception, FDLO has actually been the category darling, earning an annualized return much closer to that produced by SPY.
SPLV’s star quality is made manifest in other metrics. Table 1 illustrates two such measures—the r-squared (r2) and beta coefficients. Beta measures an ETF’s volatility relative to that of SPY. The r-squared coefficient reveals how much of an ETF’s price movements are explained by SPY’s actions.
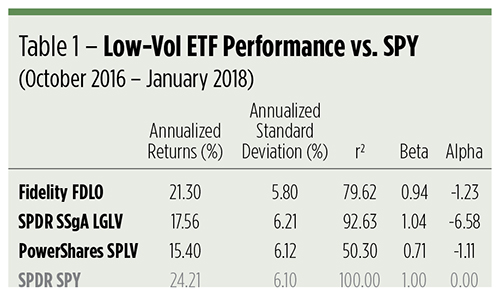
Notice that SPLV posted the lowest beta of all the low-vol funds. SPLV’s r-squared value is also low, meaning there’s real daylight between the funds’ return drivers. That further confirms the factor analysis. Factorwise, SPY and SPLV are quite different; the other funds are more closely aligned to the S&P 500 proxy and to each other.
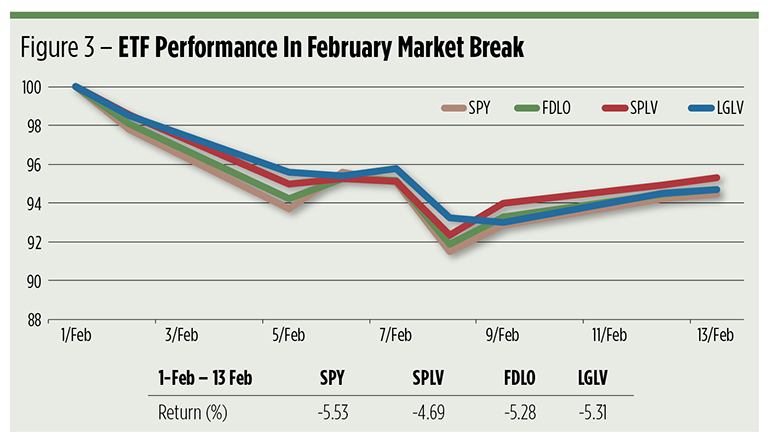
This analysis takes us up to the precipice from which the market toppled in early February. So, how did the ETFs behave in February? Figure 3 tells the tale. All the ETFs lost ground, but each fared better than SPY. The low-vol ETF that conceded the least was SPLV.
Where’s My Protection?
We’ve seen the inherent limitations of a low-vol strategy as a hedge against a sharp market downturn. A low-vol exposure can make a drawdown more shallow, but it’s unlikely to entirely eliminate it. For that, you need a proper hedge. Enter “hedged equity” products.
Foremost among ETFs plying this trade is the PowerShares S&P 500 Downside Hedged ETF (NYSE Arca: PHDG). Like SPLV, PHDG uses the S&P 500 as its universe but instead of sifting the index for quiescent stocks, the hedged equity fund exposes investors to the entire index portfolio, tempered by dynamic allocations to volatility futures and cash.
The fund’s managers actively rejigger assets as market volatility ebbs and flows: Exposure to the S&P 500 Index stocks is hiked in periods of relative quiet and to Cboe Volatility Index (CBOE:VIX) futures when VIX rises.
The problem with PHDG is the cost of maintaining its positions in VIX futures over time. It’s a very expensive tactic, even when the exposure is attenuated. In Figure 4, you can see the price paid by the fund since its December 2012 launch. The hedge caused PHDG to grossly underperform both SPY and SPLV over the long term.
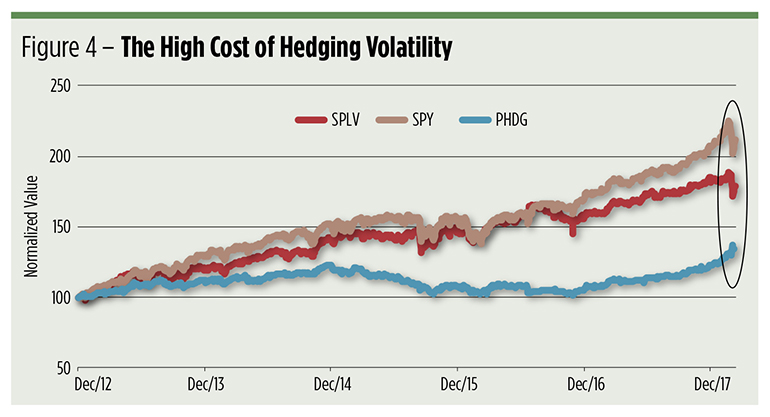
Pay attention, though, to the short-term. In particular, regard the activity highlighted inside the black oval. During the February market break, PHDG actually gained nearly 4 percent while SPY and SPLV sank.
Hedging can be effective but it must be timely, otherwise its cost is prohibitive. That’s a lesson learned by farmers long ago. Producing corn is fraught with risk, not the least of which is the possibility of selling a crop below its production cost. Luckily, price risk can be transferred to speculators through the futures markets. Farmers don’t hedge willy-nilly, however. Most hedges are laid on in tranches, if at all, and only if circumstances warrant a price lock.
How will equity investors know if and when a hedge is warranted? Four words: reversion to the mean. The February break was preceded by a period of historically low volatility and perceived tail risk. We raised a red flag about this pervasive market complacency just ahead of the break. The risk metrics were depressed much like a foot forced down upon a coiled spring. A rebound to a more normal state was inevitable.
Brad Zigler is WealthManagement's Alternative Investments Editor. Previously, he was the head of Marketing, Research and Education for the Pacific Exchange's (now NYSE Arca) option market and the iShares complex of exchange traded funds.