

Compounding is a wonderful thing. But only if you’re a saver. It’s a mixed bag if you’re an investor, especially if you buy inverse exchange-traded funds (ETFs).
Inverse ETFs, as the moniker implies, are funds designed to provide returns in reverse proportion to an index. An ever-growing cadre of ETFs offer bearish exposure to stock, bond and alternative asset benchmarks. At last count, 141 bear funds -- more than nine percent of the total ETF market -- were being pitched to investors. Two-thirds of those are leveraged, meaning they magnify bearish exposure in multiples of two or three.
Investors use inverse funds to hedge assets that can’t, for one reason or another, be immediately liquidated, or to take bearish positions on an index and amplify them with leverage.
The trouble with leveraged ETFs, especially inverse products, is underperformance. Not that the funds don’t deliver on their promises. By and large, they do. But they are mirror images of daily returns. Not monthly, not quarterly and certainly not annually.
Inverse Bonds
Bond bears got a harsh lesson in this as they scooped up swaths of the ProShares UltraShort Barclays 20+ Year Treasury (NYSE Arca: TBT) earlier this year. The $4.3 billion fund is the nation’s largest inverse ETF and offers, through its mix of swaps and futures, a double-short exposure to long-dated government bonds. Think of it as a magnified mirror image of the iShares 20+ Treasury Bond ETF (NYSE Arca: TLT) which tracks, from the long side, the very same index (there is, however, an essential difference in the two funds’ investment approach as we’ll see later).
TBT swelled in the summer of 2013 as the buzz about Fed tapering heightened. In a virtually unabated selloff between May and August, yields on the ten-year T-note spiked 112 basis points, setting up a 31.2 percent hike in TBT’s share price.
A short TLT position margined at Reg. T’s 50-percent equity requirement would have earned just 29 percent (the 14.5 percent change in TLT’s price levered twice). So, you may well ask, where’s this underperformance? It seems TBT actually outdid the short sale.
The answer lies largely in the price trajectory of the funds’ underlying index. Just take a look at the funds’ relative performance over the first four trading days of May (see Table 1).
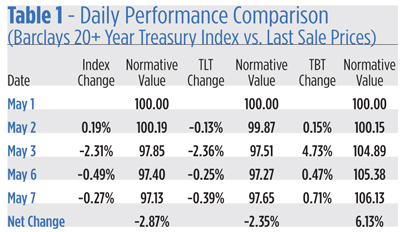
Putting the funds’ track records side by side lets you immediately see the power of daily compounding. Four consecutive gains in TBT’s market value coincided with a like number of losses in TLT but the cumulative gain enjoyed by holders of the inverse fund was more than twice that which would have been earned by TLT short sellers.
In order to maintain the fund’s fixed leverage ratio, TBT managers are obliged to (nominally) buy when the market rises and sell when it falls. That means the fund takes a larger short stance in a falling market and reduces short exposure -- that is, buys to
cover -- when the index appreciates.
Over time, this “buy high, sell low” stratagem usually delivers inferior returns compared to a short sale of the same asset. Check that word “usually,” though. Clearly, the first few days of May were unusual. Then, the bond market sold off significantly in a low volatility environment. The resulting capital gain just swamped an otherwise corrosive volatility loss.
Later, as the bond market downtrend deepened, volatility increased. The outsized gain enjoyed by the long TBT position eroded. Several factors, in fact, worked against the double short fund.
First, there was the tracking error arising from differing execution strategies. TLT uses representative sampling of the benchmark universe to create a portfolio emulating the returns of the Barclays 20+ Year Treasury Index. Since the fund isn’t a full replication of the index, there’s bound to be a bit of tracking error. On average, it’s not much, but on any given day the apparent performance spread can seem wide.
Look at the difference between the index returns and TLT’s last sale price in Table 1. It averaged 13 basis points per day. Over the longer term, though -- from January through mid-October -- the average variance diminished to just one basis point. You get a better sense of the spread by looking at standard deviation bands. This year, one standard deviation in TLT’s return amounted to 32 basis points; the greatest premium was been 105 basis points and the deepest discount 87 basis points.
Now consider TBT. The ProShares product uses derivatives, namely swap agreements and futures, to obtain short exposure to the underlying Barclays index. Like the representative sampling found in the TLT portfolio, derivatives imbue tracking track error. That error may be greater than you expect. Indeed, the standard deviation of the daily TBT/index variance has been 178 basis points this year, a fivefold multiple of TLT’s.
There’s an embedded timing error in these spreads. Fees, too, impact fund performance disproportionately. TLT’s annual expense, at 15 basis points, is cheap compared to TBT’s 90 basis point levy. The higher fee grinds off a greater proportion of the inverse fund’s return.
The interplay of all these factors, coupled with the bumpiness of the credit market, widened the TLT/TBT performance gap as 2013 wound on.
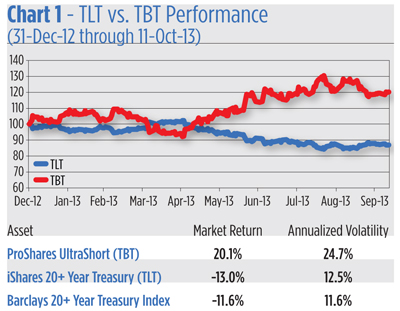
Compounding dogged TBT in autumn, leaving shareholders with relatively meager returns compared to those earned by TLT short sellers. With two-fold leverage, a short TLT position outperformed TBT, 25.9 percent vs. 20.1 percent.
If holding an inverse fund leaves money on the table in a bear market, what happens in an uptrend?
Inverse Equity
Let’s use the ProShares UltraShort S&P 500 (NYSE Arca: SDS) as an example. The double-short fund provides investors with twice the inverse daily return of the S&P 500. And, sure enough, the fund’s median daily leverage factor has been exactly -2x versus the S&P 500 this year. But the fund’s market price has fallen just 34.4 percent despite a 19.4 percent gain in the blue chip index. If SDS cranked out twice the inverse performance of over any time horizon, the fund would have slipped 38.8 percent (that is, 19.4 percent doubled).
Compare the SDS return to shorting the iShares Core S&P 500 ETF (NYSE Arca: IVV). For comparison, IVV is preferred over the SPDR S&P 500 (NYSE Arca: SPY) because IVV, like SDS, is a ’40 Act fund. SPY is a unit investment trust and therefore suffers cash drag because accumulated dividends cannot be reinvested.
At the top of the year, an IVV round lot could have been sold short with a deposit of about $7,200; the cost to buy 100 shares of SDS at the same time would have been about $5,400. So far, advantage SDS: a smaller capital commitment, no margin account set up and no worries about dividends or recalls.
The advantage soon dissipated, though. Within a month, the equity in the IVV short position diminished by 10.2 percent while the open trade loss in SDS was clocked at 9.7 percent. The gap widened by the end of the first quarter with the short IVV position 19.9 percent under water and the long SDS trade off 18.8 percent.
Believe it or not, this demonstrates underperformance by the inverse fund. To understand why, think of yourself as a hedger. A hedger takes an opposite position in a security or derivative to counteract a potentially deleterious market movement. If you wanted to hedge a rise in the S&P 500, which position would have bestowed more protection? The greater “loss” sustained by the IVV short sale clearly was a better offset.
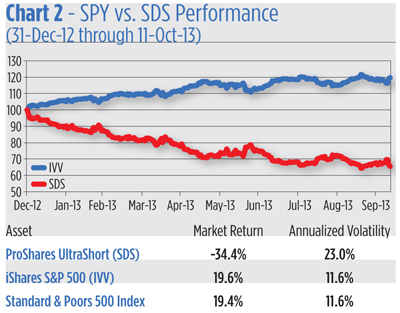
By mid-October, IVV had climbed 19.6 percent. Accounting for equity calls, the actual return of a margined short position in the iShares fund was 39.2 percent, very close to a similarly levered return of the S&P 500.
Redeeming Value
From the foregoing, you’d think inverse funds don’t represent a value proposition. But that’s not necessarily so. Inverse funds can be useful as hedge vehicles for those accounts which cannot trade on margin, such as IRAs. The caveat, of course, is that the position’s utility may diminish over time. As the fund rebalances, the managers’ proclivity to “buy high and sell low” will eventually take its toll.
Savvy investors, especially those with access to commission-free trading, can counteract the compounding effect by actively managing their ETF exposure. Rather than holding static positions, their inverse fund allocations can be adjusted for variances in market values.
Suppose, for example, you held a $100,000 portfolio hedged with an inverse fund. If the portfolio’s value rises by $1,000, you could hedge the gain by adding another $1,000 (in nominal value) to your inverse fund position.
If, on the other hand, the portfolio fell by $1,000, you’d reduce your bear fund holdings by a notional grand.
Rebalancing can be done on a daily or weekly basis, depending upon your risk tolerance.
The hedge ratio -- that is, the degree to which your portfolio is protected by inverse ETFs -- is a entirely personal decision. If you’re willing to “self insure” a certain portion of the portfolio, you’ll need fewer inverse funds shares for your hedge.