Happy New Year from the world of alternative investments.
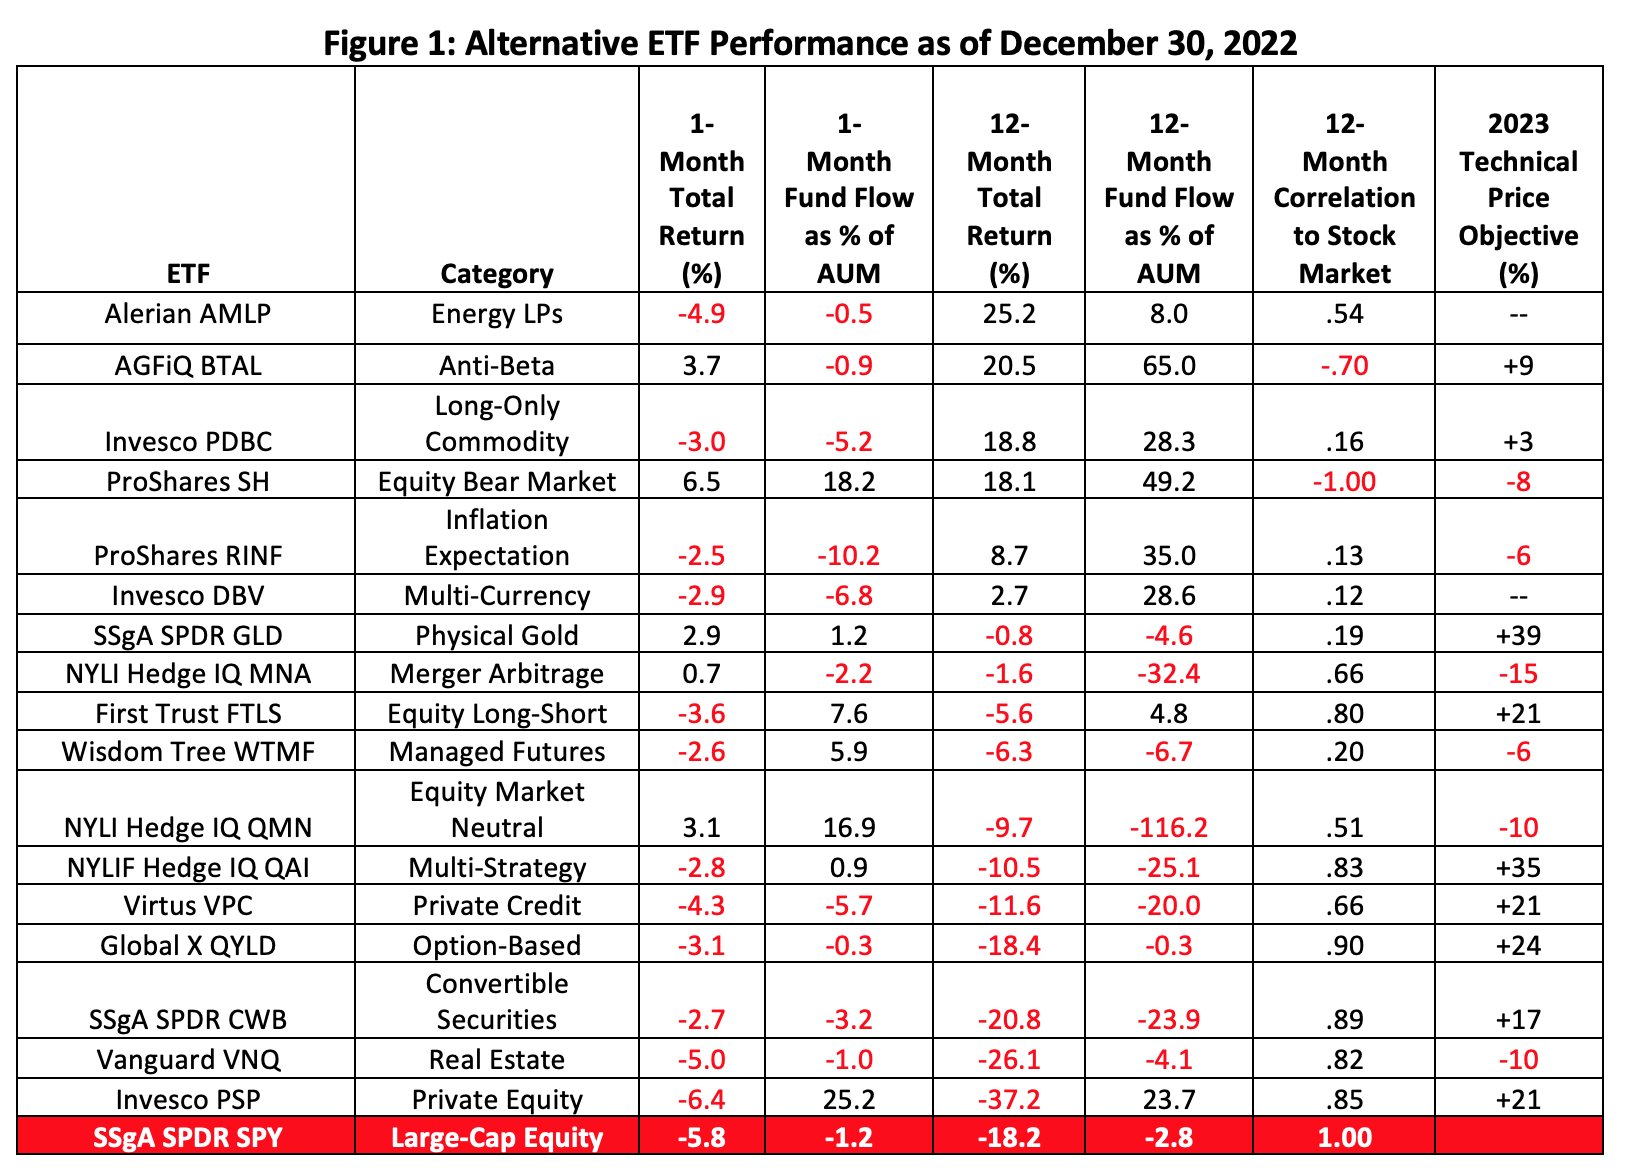
Some alt ETF sponsors are still throwing confetti while others are staggering from a 2022 hangover. Our roster of 17 alt funds below tells the tale: only six portfolios ended the year in the black. All told, though, 13 outdid the performance of the benchmark SPDR S&P 500 ETF (SPY). For the most part, a high degree of correlation to blue chip stocks predicted which fund runners would be reaching for the aspirin now.

A point worthy of note: There’s a strong relationship between 12-month returns and concomitant net fund flows. Anti-beta, long-only commodity, equity bear market, inflation expectation and multi-currency plays—all table toppers—realized double-digit inflows as capital clearly flowed to these uncorrelated assets in 2022.
The attraction of physical assets in 2022 was undeniable but technically it now seems that the trend may be peaking. The table’s last column lays out momentum-based price objectives measured from each ETF’s 2022 ending price. There seems little upside left, for example, for the Invesco Optimum Yield Diversified Commodity Strategy No K-1 ETF (PDBC). But that raises this question: For those portfolios needing commodity exposure going forward, is there a better way to obtain it?
Over the past three years of COVID-induced volatility, there were plenty of other broad-based commodity ETFs that produced better compound annual returns than PDBC. Twelve of 13 competing long-only index trackers, in fact, outdid the Invesco fund on that measure.
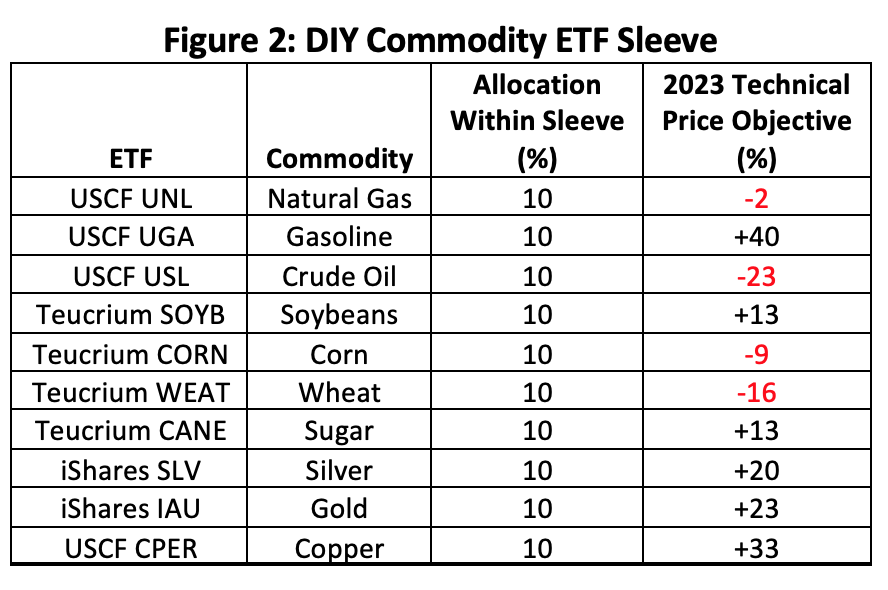
Looking beyond professionally managed commodity funds, though, a simple do-it-yourself amalgam of commodities could have yielded superior results. By allocating and maintaining equal weights to 10 single-commodity ETFs, the pros could have been bested by a significant margin. The table below illustrates how such a commodity sleeve could be structured as well as pointing out momentum-based price objectives for each allocation.

The size of the sleeve itself vis-à-vis the total portfolio is entirely discretionary. Some investors may countenance greater exposure to commodities than others. It’s the allocation within the sleeve that’s important. The only tinkering required within the sleeve is annual rebalancing which forces the realization of excess winnings and their subsequent reinvestment into underperforming funds.
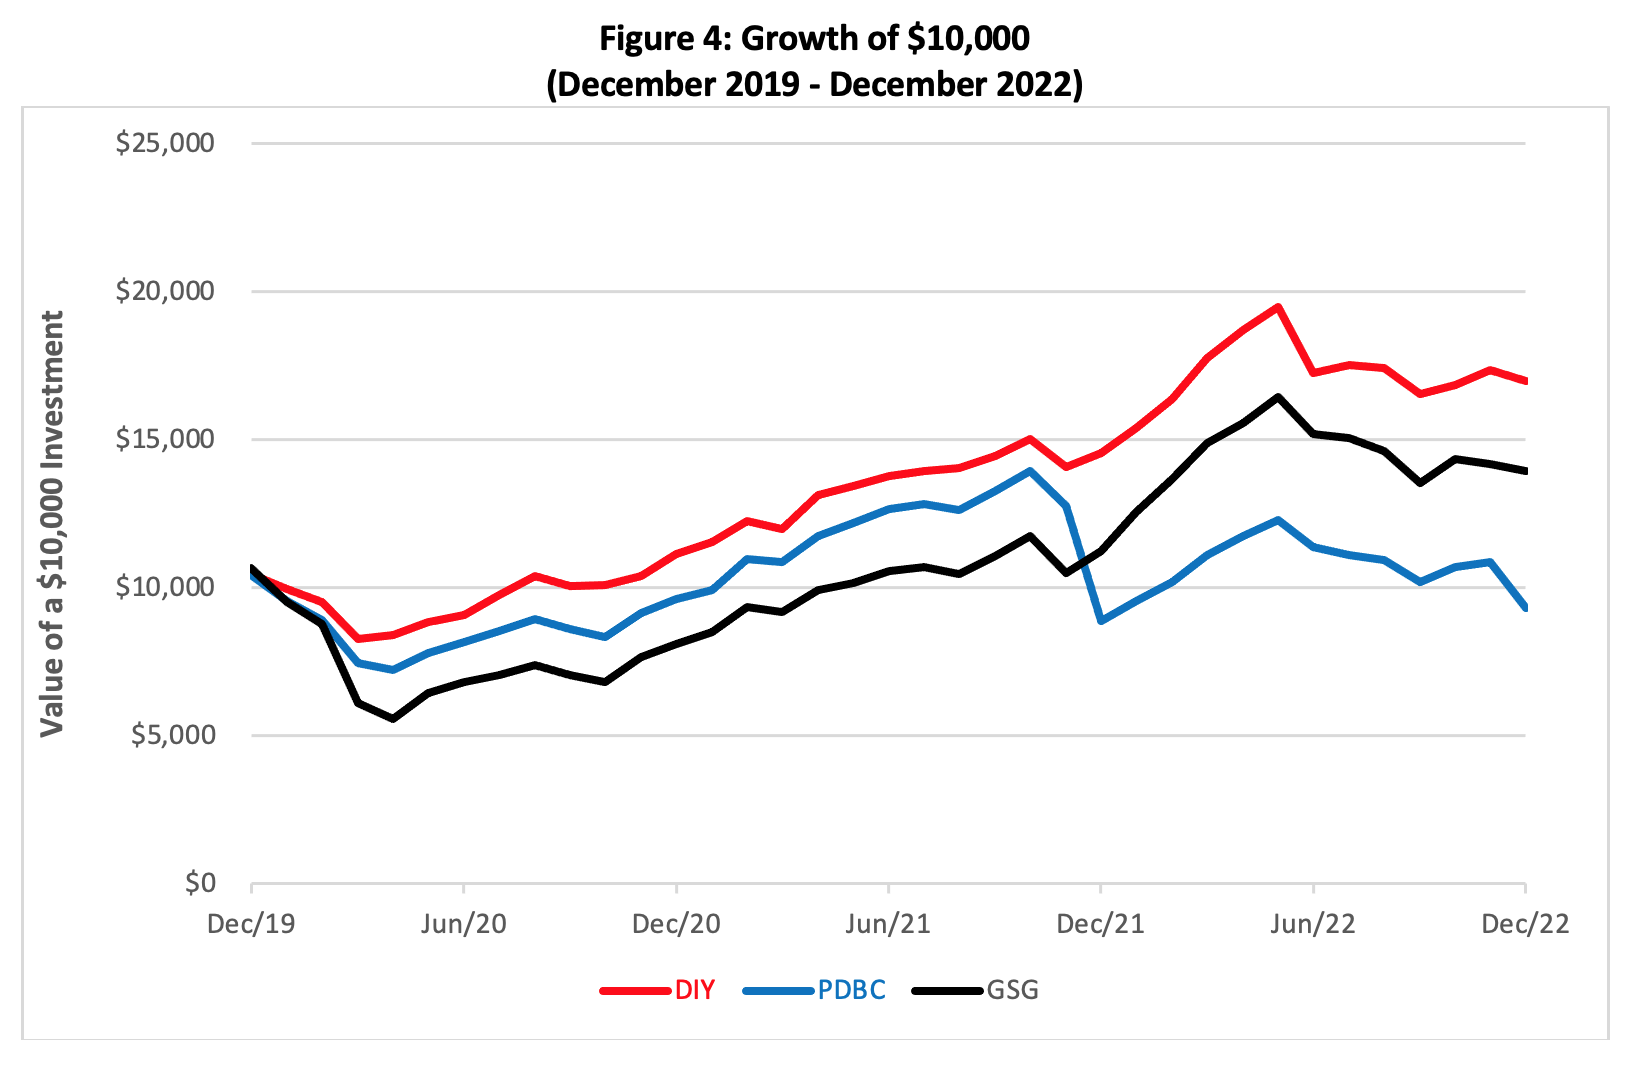
So how would the DIY sleeve have fared against broad-based commodity ETFs? Figure 3 compares the three-year performance of the DIY sleeve against PDBC, the biggest broad-based commodity ETF, and the asset class’ grand-daddy, the iShares S&P GSCI Commodity-Indexed Trust (GSG).


The aggregate holding cost of the DIY sleeve would have been 94 basis points per annum, a bit richer than the 75 bps charged by GSG and the 62 bps expense of PDBC. Still, the sleeve’s outperformance more than paid back its extra cost, at least as measured by the ratio of its average annual return to its expense ratio. An investor or advisor with access to commission-free trading—an ever more common brokerage offering— would not bear additional expense for rebalancing the sleeve.
Taxes are another consideration as many of the sleeve components are treated as commodity pools and subject to year-end mark-to-market taxation.
Is the past a prologue for the future? No one can say definitively but if exposure to real assets remains an investment priority, advisors and their clients may want to consider unpacking the DIY box in the coming year.
Brad Zigler is WealthManagement's Alternative Investments Editor. Previously, he was the head of Marketing, Research and Education for the Pacific Exchange's (now NYSE Arca) option market and the iShares complex of exchange traded funds.


