
A few weeks ago, I wrote a column “A Bond Guy Looks At Stocks” with a decidedly bearish spin; that was about 60-odd Dow points ago. In the spirit of doubling down, I offer a bit more to the very macro concerns expressed in that missive with higher-frequency inputs.
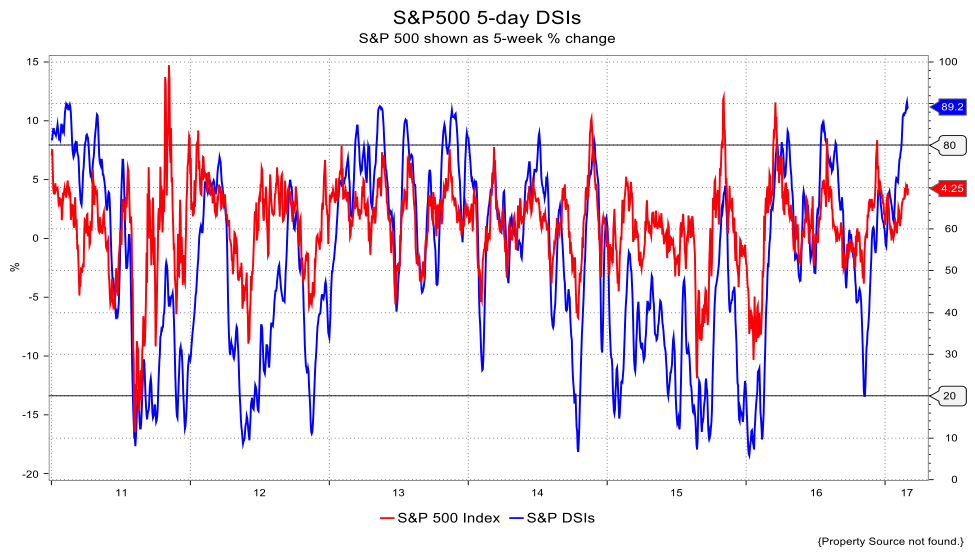
My first foray is a look at perhaps my favorite contrarian measure: the Daily Sentiment Index. I look at this across a lot of futures and when it flashes a warning, I listen. So here we find the five-day moving average on the S&P 500 at 89.2 and I deem anything over 80 to be in overbought, i.e., overly bullish, territory. Likewise, when that five-day moving average is under 20, I consider it to be overly bearish. As I hope the chart below illustrates, these are quite reliable contrarian signals.
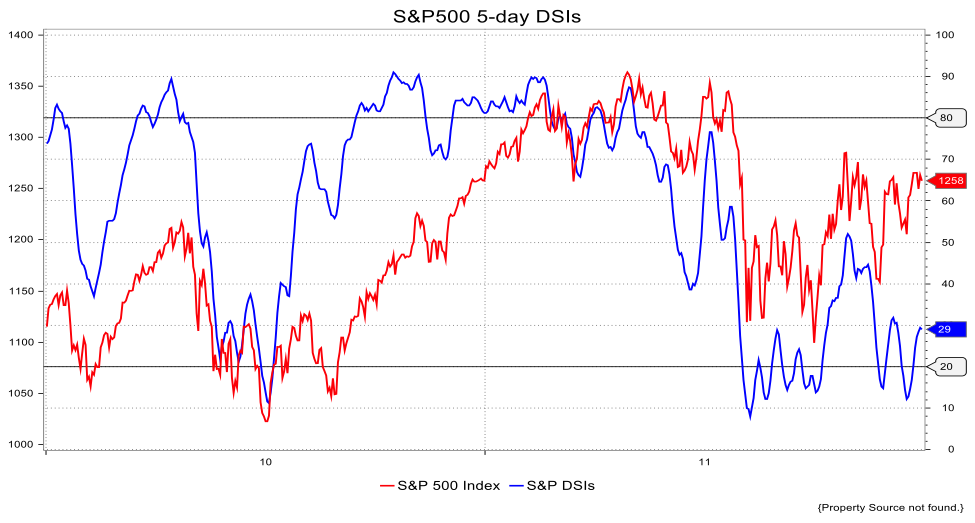
At 89.2, the 5-day DSIs are, in a word, extreme. The last time they were this high was Feb. 10–21, 2011. Three weeks later the S&P 500 fell over 80 points. On Nov. 8, 2010, DSIs touched 90.4; two weeks from there the S&P 500 had lost 45 points.
This first chart below looks at the current picture along with a five-week change in the stock index to give you a sense of direction against the 80/20 "rule" I’ve just espoused. The visual correlation is clear. Note the five-week change is on the left-hand scale and as long as it’s over 0, the index is still up in that timeframe.
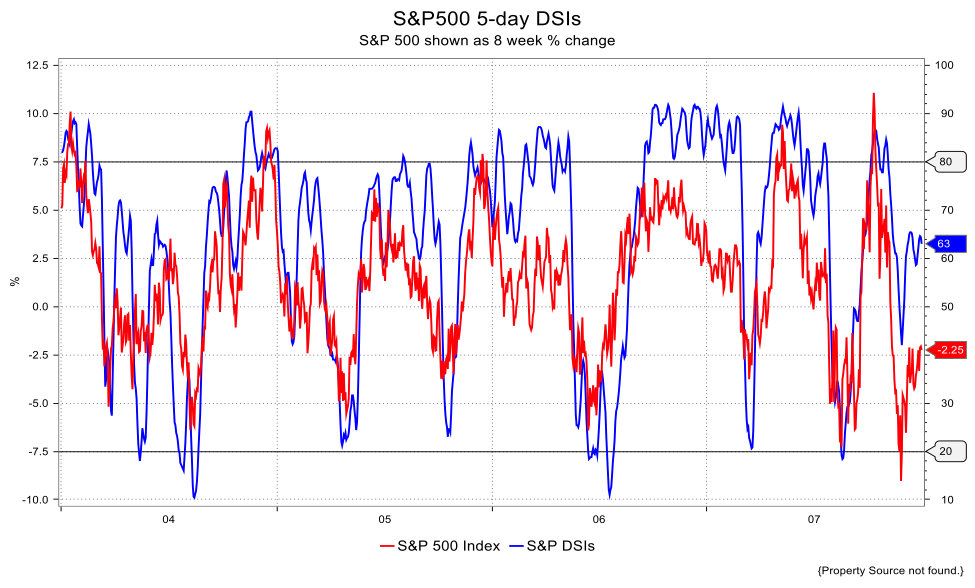
Skip to the next chart. This shows a narrower timeframe (as mentioned above) with a simple snapshot of the S&P 500 itself, not on a five-week change. Again, when DSIs get this high it tends to mark an interim high for the index. The final DSI chart shows 2005-2007 which I chose because it contains a period when DSIs remained very overbought for six months while the S&P 500 index continued to mount gains (albeit more moderate gains). Are we in a comparable period? Of course I don’t know, but such extended periods of overbought or oversold conditions are rare indeed. The 2006-7 episode is unique.
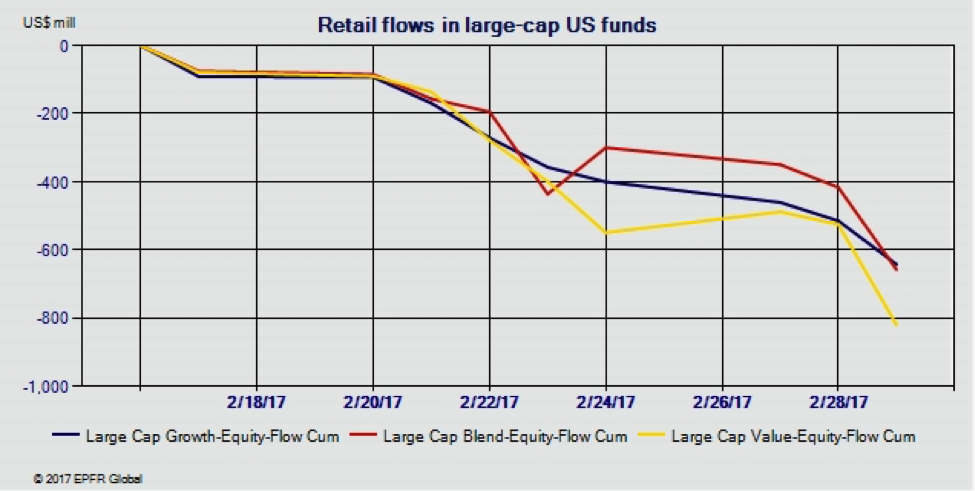
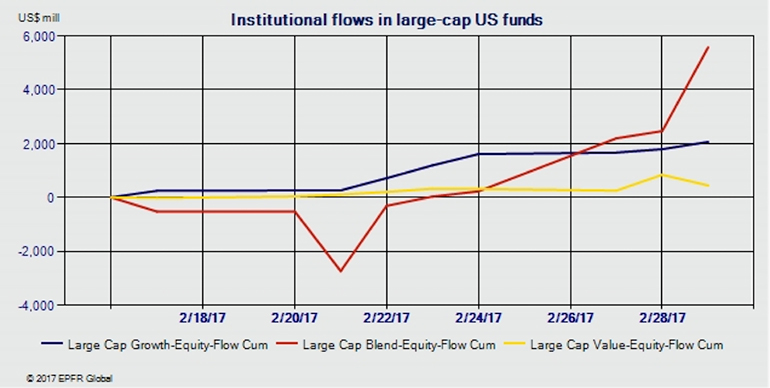
In the spirit of data mining I looked at the EPFR data from, Informa, to see who was buying into this rally. Below you’ll see the flows over the last 15 days (I’m writing on March 2) into U.S. large-cap funds by U.S.-domiciled accounts. The first chart looks at retail flows and the second at institutional; note a divergence in behavior. So-called "Mom & Pop" have been selling strength while institutional has been buying. Still, to the extent the selling by retail investors reflects confidence, well, it shows a lack of confidence. The institutional side perhaps is chasing performance or, maybe they’re the smarter money. I offer it up as an addendum to the DSI pictures that started this particularly piece.
David Ader is Chief Macro Strategist for Informa Financial Intelligence. For further information, please see: https://financialintelligence.informa.com/