
Over the past few years, factor investing, or so-called “smart beta” investment strategies, have been wildly popular—among investment product providers, at least.
Yet the origins of factor investing date back to the ’60s and ’70s, when William Sharpe, Harry Markowitz and Merton Miller won the Nobel Prize in economics for creating the Capital Asset Pricing Model (CAPM)—the original factor model.
CAPM states that the return on an investment is a function of its sensitivity to market risk, or beta. Investments with a higher beta should be rewarded with higher returns relative to a “risk-free” asset, known as return premium, to offset the higher risk. According to CAPM, an investment’s return is determined solely by its exposure to the market factor or beta.
Simply put, an investment’s risk can be explained and shaped by the investment’s underlying factors. Studies have revealed that certain factors reward investors with a return premium for bearing the additional risk.
Below, we meander through the evolving landscape and examine different strategies that can be used to implement factor frameworks in client portfolios.
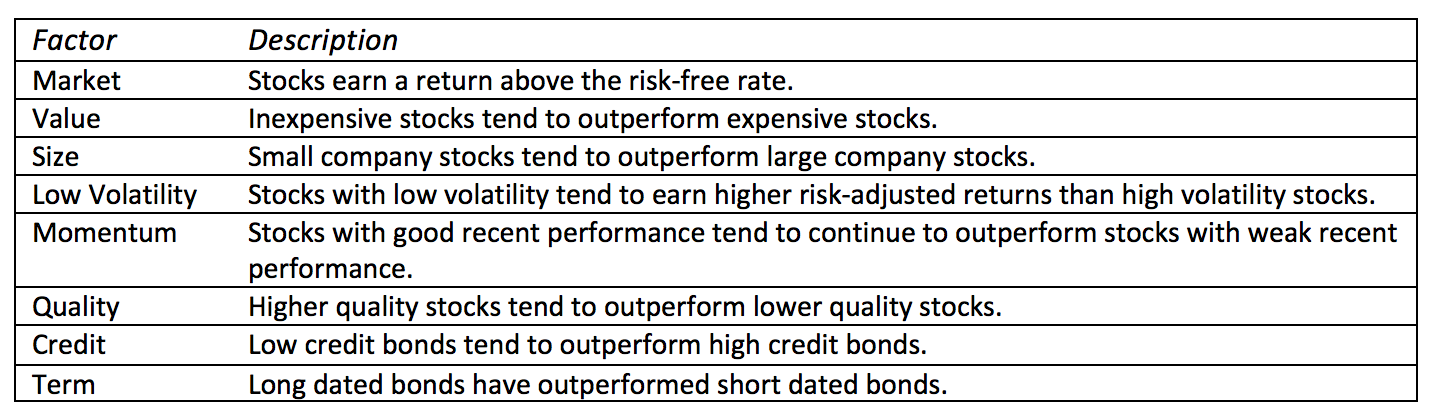
In 1993, Eugene Fama and Kenneth French expanded the CAPM to include value and size factors, to coincide with the market factor, known as the “Fama and French Three-Factor Model.” Over the years, the number of factors has expande- as investment firms continue to search for factors that will contribute to higher risk-adjusted returns. Below are some of the more popular factors in use today.
In figure 1, we take a closer look at the return-risk characteristics for the factors that have at least five years of history represented by MSCI indexes.

Figure 1
Over the past 20 years, the low-volatility factor (MSCI World Minimum Volatility index) has provided investors with the best risk-adjusted performance and risk-return tradeoff characteristics. Not only does the low-volatility factor reward investors with outperformance versus the market, represented by the MSCI ACWI index, it achieves this performance with lower risk. The value (MSCI ACWI Value) and size (MSCI ACWI Small Cap) factors also outperform and generate superior risk-adjusted returns.
As we mentioned above, the value factor is based on value stocks outperforming growth stocks, while the size factor rests on small-cap stocks outperforming large-cap stocks. Figure 1 confirms these statements, as the value and size factors outperform their sister factors.
Now that we have confirmed that the low-volatility, value, and size factors do reward investors with superior risk-adjusted returns, we can look at the effects these factors play in different portfolios.
As we know, markets go through cycles, and unless you have a crystal ball, it is very difficult to time these cycles. As you can see in figure 2, the factors perform differently during the market cycles, which is very useful when constructing a portfolio. During market booms, the size factor, and to a certain extent the value factor, perform well. As expected, during a recession, the low-volatility factor helps minimize downside risk, leading to a potentially quicker recovery.

Figure 2
There are different strategies that can be implemented when incorporating factors into a client portfolio. The first is a satellite strategy, like smart beta strategies, which is employed by using a broad market-investment vehicle as the core, while incorporating products that focus on the individual factors as the ancillary pieces in an attempt to add alpha. Employing a satellite approach provides additional market-cycle diversification and reduces the need to correctly time the market cycles, while also trying to increase risk-adjusted performance.
Another strategy is to cut out a piece of the client portfolio, say 10 percent, and invest in one or two of the factors. For example, adding a low-volatility investment vehicle for a risk-averse client. This strategy is useful for clients with a specific goal; for example, capital preservation. Figure 3 displays the two strategies and how they compare. As you can see, adding a low-volatility factor (10%) to a traditional, global balanced portfolio produces superior risk-adjusted performance.

Figure 3 - Satellite Strategy: MSCI ACWI 30%, MSCI World Minimum Volatility 10%, MSCI ACWI Value 10%, MSCI ACWI Small Cap 10%, Bloomberg Barclays Global Aggregate 40%. 60/40 with 10% Allocation to Factor: Russell 3000 25%, MSCI EAFE 15%, MSCI EM 10%, MSCI World Minimum Volatility 10%, Bloomberg Barclays Global Aggregate 40%. Index: MSCI ACWI 60%, Blomberg Barclays Global Aggregate 40%. All portfolios rebalanced annually.
Factors do not only apply to equities. There are also fixed income factors such as credit, liquidity and term. From the above analysis, one can conclude that certain factors do contribute to increased risk-adjusted performance. Depending on investment objective, different strategies incorporating factors can benefit your clients when used correctly. But it’s important to understand the benefits and risks associated with factor-based investing, and whether they are appropriate for your clients.
Ryan Nauman is a VP, Product, and Market Strategist at Informa Financial Intelligence. His market analysis and commentaries are available at www.informais.com/blog.