
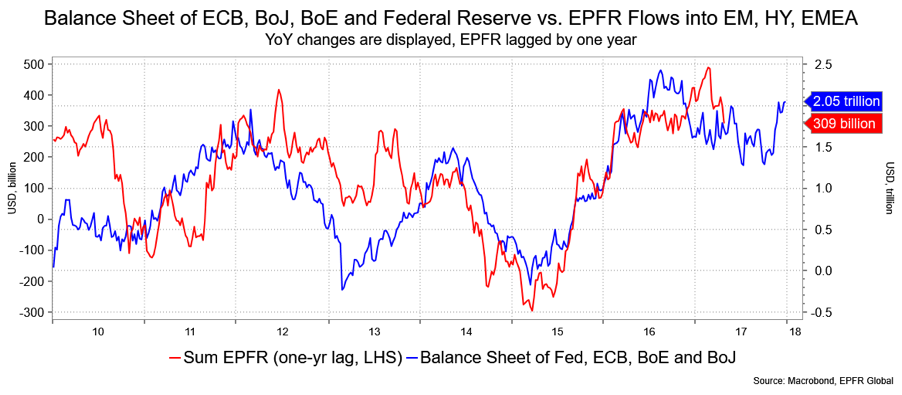
An old colleague of mine asked me to send him a chart of central bank balance sheets against EPFR flows into emerging markets, EMEA bond and equity funds and high-yield funds. The idea was to find the year-over-year change in central bank balance sheets, i.e., the liquidity provision against flows into risk assets.
The result is the chart below: I make no claim as to this being my idea.
What you see is a close visual correlation. I Iagged the flows pulled from EPFR (this is an Informa product with data on fund flows, as well as trends and signals), i.e., moved them up by nearly a year to show that the balance sheet changes led the flows. It should follow that as central banks unwind their balance sheets, liquidity (logically) is reduced—think about it in terms of what “stuff” central banks stop buying (or selling) that will have to be absorbed by the market—for areas that such buying supported. What this chart doesn’t show is the projection for those balance sheets in the coming years, although we can anticipate that they’ll be reduced, for example, by the Fed.
Combine that with higher rates and you’ve got tailwinds swinging around to become headwinds.
David Ader is Chief Macro Strategist for Informa Financial Intelligence.