The mid-cap value style ranks tenth out of the twelve fund styles as detailed in my Style Rankings for ETFs and Mutual Funds report. It gets my Dangerous rating, which is based on aggregation of ratings of 12 ETFs and 196 mutual funds in the mid-cap value style as of February 12th, 2013. Prior reports on the best & worst ETFs and mutual funds in every sector and style are here.
Figures 1 and 2 show the five best and worst-rated ETFs and mutual funds in the style. Not all mid-cap value style ETFs and mutual funds are created the same. The number of holdings varies widely (from 25 to 2898), which creates drastically different investment implications and ratings. The best ETFs and mutual funds allocate more value to Attractive-or-better-rated stocks than the worst, which allocate too much value to Neutral-or-worse-rated stocks.
To identify the best and avoid the worst ETFs and mutual funds within the mid-cap value style, investors need a predictive rating based on (1) stocks ratings of the holdings and (2) the all-in expenses of each ETF and mutual fund. Investors need not rely on backward-looking ratings. My fund rating methodology is detailed here.
Investors should not buy any mid-cap value ETFs or mutual funds because none get an Attractive-or-better rating. If you must have exposure to this style, you should buy a basket of Attractive-or-better rated stocks and avoid paying undeserved fund fees. Active management has a long history of not paying off.
Get my ratings on all ETFs and mutual funds in this style on my free mutual fund and ETF screener.
Figure 1: ETFs with the Best & Worst Ratings – Top 5
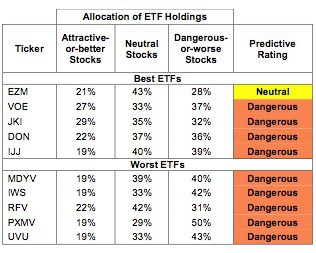 * Best ETFs exclude ETFs with TNAs less than $100 million for inadequate liquidity.
Sources: New Constructs, LLC and company filings
First Trust Mid Cap Value AlphaDEX Fund (FNK) and Vanguard S&P Mid-Cap 400 Value ETF (IVOV) are excluded from Figure 1 because their total net assets (TNA) are below $100 million and do not meet our liquidity standards.
Figure 2: Mutual Funds with the Best & Worst Ratings – Top 5
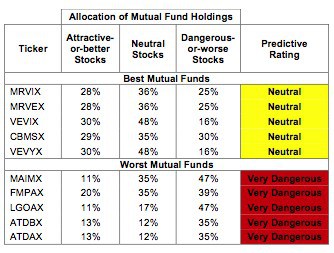 * Best mutual funds exclude funds with TNAs less than $100 million for inadequate liquidity.
Sources: New Constructs, LLC and company filings
Eight mutual funds are excluded from Figure 2 because their total net assets (TNA) are below $100 million and do not meet our liquidity standards.
WisdomTree MidCap Earnings Fund (EZM) is my top-rated mid-cap value ETF and Marshall Funds, Inc d/b/a BMO Funds: BMO Mid-Cap Value Fund (MRVIX) is my top-rated mid-cap value mutual fund. Both earn my Neutral rating.
ProShares Ultra Russell MidCap Value (UVU) is my worst-rated mid-cap value ETF and earns my Dangerous rating. AIM Investment Funds : Invesco Endeavor Fund (AYDAX) is my worst-rated mid-cap value mutual fund and earns my Very Dangerous rating.
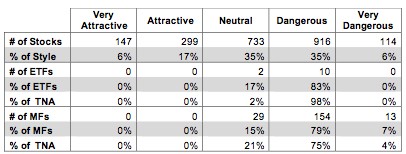
Figure 3 shows that 446 out of the 2209 stocks (over 23% of the market value) in mid-cap value ETFs and mutual funds get an Attractive-or-better rating. However, none of the 12 mid-cap value ETFs and none of the 196 mid-cap value mutual funds get an Attractive-or-better rating.
The takeaways are: mutual fund managers allocate too much capital to low-quality stocks and mid-cap value ETFs hold poor quality stocks.
Figure 3: Mid-cap Value Style Landscape For ETFs, Mutual Funds & Stocks
 Sources: New Constructs, LLC and company filings
As detailed in “Cheap Funds Dupe Investors”, the fund industry offers many cheap funds but very few funds with high-quality stocks, or with what I call good portfolio management.
Investors need to tread carefully when considering mid-cap value ETFs and mutual funds, as no ETFs and no mutual funds in the mid-cap value style allocate enough value to Attractive-or-better-rated stocks to earn an Attractive rating. Focus on creating your own basket of stocks instead.
Lear Corporation (LEA) is one of my favorite stocks held by mid-cap value ETFs and mutual funds and earns my Very Attractive rating. LEA grew its after-tax profits (NOPAT) by 14% in the last reported fiscal year. It has a top-quintile return on invested capital (ROIC) of 22% and rising economic earnings. Despite these impressive numbers, LEA is valued at only ~$53.40/share. This valuation gives it a price to economic book value ratio of 0.5, implying LEA’s NOPAT will permanently decline by half. Those low cash flow expectations offer attractive risk/reward for a company that has shown strong profit growth..
Principal Financial Group (PFG) is one of my least favorite stocks held by mid-cap value ETFs and mutual funds and earns my Very Dangerous rating. PFG has earned negative economic profits in every year since 2001, as far back as our model goes. In the last reported fiscal year its economic earnings were -$4.70/share, the lowest they have been since 2001. Despite these dismal numbers, PFG is valued at ~$31.10/share. This valuation implies NOPAT growth of 8% compounded annually for the next 19 years. Betting on such high, long-term growth for a company with no recent track record of economic profitabilitydoes not seem like smart risk/reward.
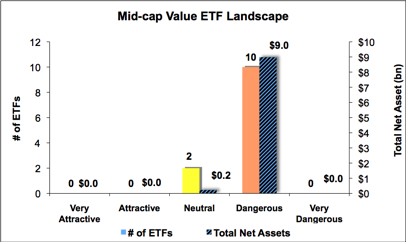
Figures 4 and 5 show the rating landscape of all mid-cap value ETFs and mutual funds.
My Style Rankings for ETFs and Mutual Funds report ranks all styles and highlights those that offer the best investments.
Figure 4: Separating the Best ETFs From the Worst Funds
 Sources: New Constructs, LLC and company filings
Figure 5: Separating the Best Mutual Funds From the Worst Funds
 Sources: New Constructs, LLC and company filings
Review my full list of ratings and rankings along with reports on all 12 ETFs and 196 mutual funds in the mid-cap value style.
Sam McBride contributed to this report.
Disclosure: David Trainer and Sam McBride receive no compensation to write about any specific stock, sector or theme.