The Large Cap Blend style ranks first out of the twelve fund styles as detailed in my Style Rankings for ETFs and Mutual Funds report. It gets my Neutral rating, which is based on aggregation of ratings of 33 ETFs and 908 mutual funds in the Large Cap Blend style as of October 17, 2013. Prior reports on the best & worst ETFs and mutual funds in every sector and style are here.
Figures 1 and 2 show the five best and worst-rated ETFs and mutual funds in the style. Not all Large Cap Blend style ETFs and mutual funds are created the same. The number of holdings varies widely (from 18 to 1,008). This variation creates drastically different investment implications and, therefore, ratings. The best ETFs and mutual funds allocate more value to Attractive-or-better-rated stocks than the worst, which allocate too much value to Neutral-or-worse-rated stocks.
To identify the best and avoid the worst ETFs and mutual funds within the Large Cap Blend style, investors need a predictive rating based on (1) stocks ratings of the holdings and (2) the all-in expensesof each ETF and mutual fund. Investors need not rely on backward-looking ratings. My fund rating methodology is detailed here.
Investors seeking exposure to the Large Cap Blend style should buy one of the Attractive-or-better rated ETFs or mutual funds from Figures 1 and 2.
Get my ratings on all ETFs and mutual funds in this style by searching for Large Cap Blend on my freemutual fund and ETF screener.
Figure 1: ETFs with the Best & Worst Ratings – Top 5
 * Best ETFs exclude ETFs with TNAs less than $100 million for inadequate liquidity.
Sources: New Constructs, LLC and company filings
iShares Russell Top 200 ETF (IWL) is excluded from Figure 1 because its total net assets (TNA) are below $100 million and do not meet our liquidity minimums.
Figure 2: Mutual Funds with the Best & Worst Ratings – Top 5
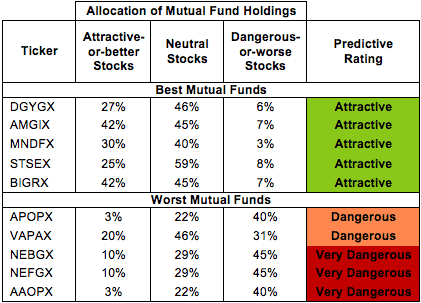
* Best mutual funds exclude funds with TNAs less than $100 million for inadequate liquidity.
Sources: New Constructs, LLC and company filings
Nuveen Concentrated Core Fund (NCAFX, NCAEX) is excluded from Figure 2 because its total net assets (TNA) are below $100 million and do not meet our liquidity minimums.
iShares Morningstar Large-Cap ETF (JKD) is my top-rated Large Cap Blend ETF and Dreyfus Appreciation Fund (DGYGX) is my top-rated Large Cap Blend mutual fund. Both earn my Attractive rating. For those turned off by DGYGX’s $1 million minimum investment, BlackRock Exchange Portfolio (STSEX) also earns an Attractive rating and requires only $1,000 as a minimum.
ALPS/GS Risk Adjusted Return U.S. Large Cap Index ETF (GSRA) is my worst-rated Large Cap Blend ETF and Cavanal Hill Opportunistic Fund (AAOPX) is my worst-rated Large Cap Blend mutual fund. GSRA earns my Dangerous rating and AAOPX earns my Very Dangerous rating.
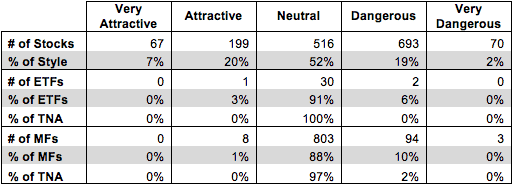
Figure 3 shows that 266 out of the 1,545 stocks (over 27% of the market value) in Large Cap Blend ETFs and mutual funds get an Attractive-or-better rating. However, only one out of 33 Large Cap Blend ETFs (less than 1% of total net assets) and eight out of 908 Large Cap Blend mutual funds (less than 1% of total net assets) get an Attractive-or-better rating.
The takeaways are: mutual fund managers allocate too much capital to low-quality stocks and Large Cap Blend ETFs hold poor quality stocks.
Figure 3: Large Cap Blend Style Landscape For ETFs, Mutual Funds & Stocks
 Sources: New Constructs, LLC and company filings
As detailed in “Low-Cost Funds Dupe Investors”, the fund industry offers many cheap funds but very few funds with high-quality stocks, or with what I call good portfolio management.
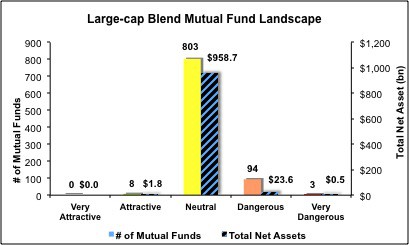
Investors need to tread carefully when considering Large Cap Blend ETFs and mutual funds, as there is more bad than good in this style. Two out of 33 ETFs and 97 out of 908 mutual funds in the Large Cap Blend style earn a Dangerous-or-worse rating. There should not be more Dangerous funds than Attractive ones when the proportional market caps of Attractive-or-better rated stocks (27%) exceeds the market caps of Dangerous-or-worse stocks (21%)
Intel Corp (INTC) is one of my favorite stocks held by Large Cap Blend ETFs and mutual funds and earns my Very Attractive rating. INTC has a top-quintile return on invested capital (ROIC) of 20%. Investors should not be overly concerned about the company’s declining ROIC over the past two years. The company’s increased spending on R&D as they make the transition from PC chips to mobile and tablets can explain the decline. INTC boosted R&D spending by 55% from 2010 to 2012. INTC’s R&D spending only increased by 69% from 2000 to 2010. INTC’s $23 billion of excess cash gives it the resources to develop the technology to succeed in a changing industry. The company’s new chips are already earningnumerous design wins for tablets.
INTC is attractively valued despite its ROIC decline over the past two years. At its current valuation of ~$24/share, INTC has a price to economic book value ratio of only 0.8, which implies a permanent 20% decline in INTC’s operating profit (NOPAT). Unless you think INTC is going to completely fail in its attempt to transition to tablets and mobile, the stock looks undervalued at these levels.
Morgan Stanley (MS) is one of my least favorite stocks held by Large Cap Blend ETFs and mutual funds and earns my Dangerous rating. MS has not seen sustained NOPAT growth in over a decade. Its NOPAT in 2012 was 5% less than its NOPAT in 2000. Even though NOPAT hasn’t increased, MS has more than tripled its invested capital over those same twelve years, so its ROIC has declined from 25% to 6%. Despite this long-term stagnation, MS is valued for significant growth. To justify its valuation of ~$29/share, MS needs to grow NOPAT by 14% compounded annually for 15 years. The disconnect between performance and expectations should raise a big red flag for investors.
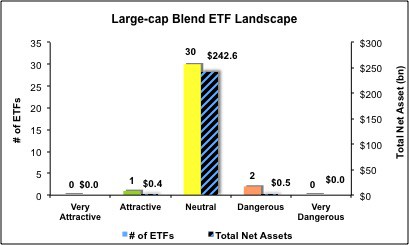
Figures 4 and 5 show the rating landscape of all Large Cap Blend ETFs and mutual funds.
My Style Rankings for ETFs and Mutual Funds report ranks all styles and highlights those that offer the best investments.
Figure 4: Separating the Best ETFs From the Worst Funds
 Sources: New Constructs, LLC and company filings
Figure 5: Separating the Best Mutual Funds From the Worst Funds
 Sources: New Constructs, LLC and company filings
Review my full list of ratings and rankings along with reports on all 33 ETFs and 908 mutual funds in the Large Cap Blend style
Sam McBride contributed to this report.
Disclosure: David Trainer owns INTC. David Trainer and Sam McBride receive no compensation to write about any specific stock, sector, style or theme.