The All Cap Value style ranks fifth out of the twelve fund styles as detailed in my Style Rankings for ETFs and Mutual Funds report. It gets my Neutral rating, which is based on aggregation of ratings of 2 ETFs and 238 mutual funds in the All Cap Value style as of October 17, 2013. Prior reports on the best & worst ETFs and mutual funds in every sector and style are here.
Figure 1 ranks from best to worst the two all-cap value ETFs and Figure 2 shows the five best and worst-rated all-cap value mutual funds. Not all All Cap Value style ETFs and mutual funds are created the same. The number of holdings varies widely (from 7 to 1948). This variation creates drastically different investment implications and, therefore, ratings. The best ETFs and mutual funds allocate more value to Attractive-or-better-rated stocks than the worst, which allocate too much value to Neutral-or-worse-rated stocks.
To identify the best and avoid the worst ETFs and mutual funds within the All Cap Value style, investors need a predictive rating based on (1) stocks ratings of the holdings and (2) the all-in expenses of each ETF and mutual fund. Investors need not rely on backward-looking ratings. My fund rating methodology is detailed here.
Investors seeking exposure to the All Cap Value style should buy one of the Attractive-or-better rated mutual funds from Figure 2. There are no Attractive-or-better rated All Cap Value ETFs for investors to choose from.
Get my ratings on all ETFs and mutual funds in this style by searching for All Cap Value on my free mutual fund and ETF screener.
Figure 1: ETFs with the Best & Worst Ratings – Only 2
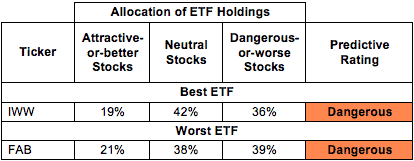 * Best ETFs exclude ETFs with TNAs less than $100 million for inadequate liquidity.
Sources: New Constructs, LLC and company filings
Figure 2: Mutual Funds with the Best & Worst Ratings – Top 5
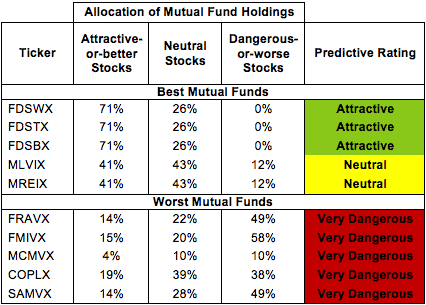 * Best mutual funds exclude funds with TNAs less than $100 million for inadequate liquidity.
Sources: New Constructs, LLC and company filings
iShares Russell 3000 Value ETF (IWW) is my top-rated All Cap Value ETF and SunAmerica Focused Dividend Strategy Portfolio (FDSWX) is my top-rated All Cap Value mutual fund. IWW gets my Dangerous rating, while FDSWX gets my Attractive rating.
First Trust Multi Cap Value AlphaDEX Fund (FAB) is my worst-rated All Cap Value ETF and RidgeWorth Mid Cap Value Equity Fund (SAMVX) is my worst-rated All Cap Value mutual fund. FAB earns my Dangerous rating, while SAMVX gets my Very Dangerous rating.
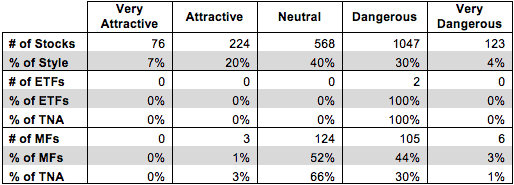
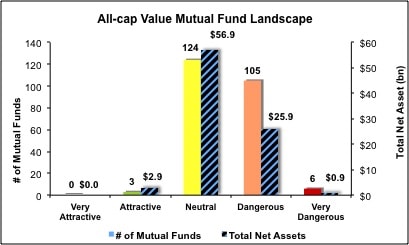
Figure 3 shows that 300 out of the 2038 stocks (over 27% of the market value) in All Cap Value ETFs and mutual funds get an Attractive-or-better rating. However, neither of the two All Cap Value ETFs and 3 out of 238 All Cap Value mutual funds (less than 3% of total net assets) get an Attractive-or-better rating.
The takeaways are: mutual fund managers allocate too much capital to low-quality stocks and All Cap Value ETFs hold poor quality stocks.
Figure 3: All Cap Value Style Landscape For ETFs, Mutual Funds & Stocks
 Sources: New Constructs, LLC and company filings
As detailed in “Low-Cost Funds Dupe Investors”, the fund industry offers many cheap funds but very few funds with high-quality stocks, or with what I call good portfolio management.
Investors need to tread carefully when considering All Cap Value ETFs and mutual funds, as there are only a handful worth buying. No ETFs and 3 mutual funds in the All Cap Value style allocate enough value to Attractive-or-better-rated stocks to earn an Attractive rating. Investors should buy one of the Attractive-rated SunAmerica mutual funds or focus on individual stocks.
Western Union (WU) is one of my favorite stocks held by All Cap Value ETFs and mutual funds and earns my Very Attractive rating. WU has a return on invested capital of 27%, which puts it in the top quintile of all companies I cover. Since it went public in 2006, WU has generated positive and growing economic earnings. While WU has not seen explosive profit growth (4% compounded annually since 2006) that may attract momentum investors, high NOPAT margins (20%) and growth opportunities in China position the business well for the long haul. Despite these solid fundamentals, WU trades at ~18/share, which gives it a price to economic book value (PEBV) ratio of 0.7. This valuation implies that the market expects WU’s profits to decline by 30% and never recover. With WU’s already vast infrastructure, consistent track record of turning a profit, and growth in its foreign markets, such a large permanent decline in NOPAT looks unlikely. Investors should seriously consider this stock while it trades at this discount.
Citigroup (C) is one of my least favorite stocks held by All Cap Value ETFs and mutual funds and earns my Dangerous rating. Citi’s profits (NOPAT) have declined by 4% compounded annually since 2000, and have yet to stabilize after recovering from the financial crisis in 2008. Citi has also seen revenue drops of 10% each of the past 2 years. Worst of all, Citi has earned increasingly large negative economic earningsevery year since the beginning of my model in 1998. Despite these negative trends, many investors could reasonably consider Citi a worthwhile investment because of its huge market share in the global financial system, if not for its extremely expensive valuation of ~$51/share. To justify this price, Citi would need to grow NOPAT by 15% for each of the next 10 years. These are high expectations for any company, let alone one operating in an uncertain regulatory market. All the potential upside for Citi appears priced into the stock already. Investors should avoid Citi as long as it remains this risky and overvalued.
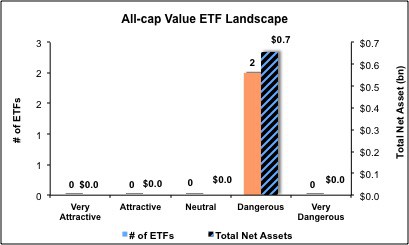
Figures 4 and 5 show the rating landscape of all All Cap Value ETFs and mutual funds.
My Style Rankings for ETFs and Mutual Funds report ranks all styles and highlights those that offer the best investments.
Figure 4: Separating the Best ETFs From the Worst Funds
 Sources: New Constructs, LLC and company filings
Figure 5: Separating the Best Mutual Funds From the Worst Funds
 Sources: New Constructs, LLC and company filings
Review my full list of ratings and rankings along with reports on all 2 ETFs and 238 mutual funds in the All Cap Value style.
André Rouillard contributed to this report.
Disclosure: David Trainer owns WU. David Trainer and André Rouillard receive no compensation to write about any specific stock, sector, style or theme.