Asset flows to ETFs are on track to break 2008’s record, reeling in $154 billion year-to-date through November, according to Morningstar. But a special report released by BlackRock today reveals some surprising ETF trends that came out of 2012. The trends tell us more about investor behavior over the last 12 months than the markets themselves.
Surprising trends:
1. ETP flows maintained positive momentum throughout changing risk-on and risk-off market conditions. Despite good equity returns, mutual fund flows suffered (especially domestic equity funds). But ETFs managed to buck the trend, taking in strong inflows throughout the year, even during down periods in the markets. (See early April to early June, BlackRock says.)
But how are flows impacted during longer downside periods? Remarkably, the strongest year for ETP inflows was 2008, a year in which the MSCI All Country World Index was down 43 percent.
2. Declining and persistently low interest rates have not dampened fixed income ETP flows, now at an all time high of $68 billion through November and 13 percent higher than the annual record set in 2009. This does not really surprise me, as we know that investors have flocked to bond funds in their flight to safety and search for income. Strong flows went to investment grade corporate, high yield and emerging market debt, BlackRock says.
3. Minimum Volatility Equity ETPs were one of the more successful strategy-based categories with $4.4 billion of inflows, capitalizing on investors’ desire to manage volatility. 2012 has been the year for low-volatility strategies, with many fund managers launching new funds in this category to attract investors scared of market volatility. But as I’ve written here, these funds can be problematic. “My concern on this is that a lot of times products are designed looking backward and by the time they get out, they really are designed for market conditions that have happened over the previous few years and they end up selling well because people have that memory over the last few years and believe they’re buying the antidote to what’s happened,” said Christian Magoon, CEO of Magoon Capital, an asset management consulting firm. “But oftentimes markets change quite a bit, and a reversal in the way markets work would probably limit the upside potential of a lot of investors.”
4. The jury’s still out on active ETFs. “While much has been written about active ETPs as a future driver of growth, the potential remains largely untapped with the category representing 1 percent of industry assets and 3 percent of 2012 YTD flows,” BlackRock writes. PIMCO, of course, was the outlier, collecting 73 percent of all flows into active ETPs with the launch of its PIMCO Total Return ETF. See Stan Luxenberg’s August story.
5. Gold accounts for such a large portion of the commodity asset class that one could argue it’s become its own asset class. Gold now accounts for 8 percent of global ETP assets, 70 percent of commodity assets and 83 percent of YTD commodity flows, BlackRock says.
6. Much has been written about ETP closures, but innovation continues. While ETF product launches has slowed this year, new funds took in more than $27 billion in assets, BlackRock says.
7. Assets in Emerging Markets debt ETPs doubled in 2012 to $20 billon. “Credit quality in this asset class can be higher than often perceived,” BlackRock said.
8. Canada had the highest asset growth rate of any region at 29 percent for 2012. Did you know that the first ETF was launched in Canada and began trading in 1990? Canada currently boasts 272 ETF products.
9. Among the fifteen highest asset-gathering ETPs launched in 2012, 10 are listed in Asia Pacific and six of those provide exposure to Chinese equities. While the Asia Pacific region accounts for only 6 percent of total global assets, more than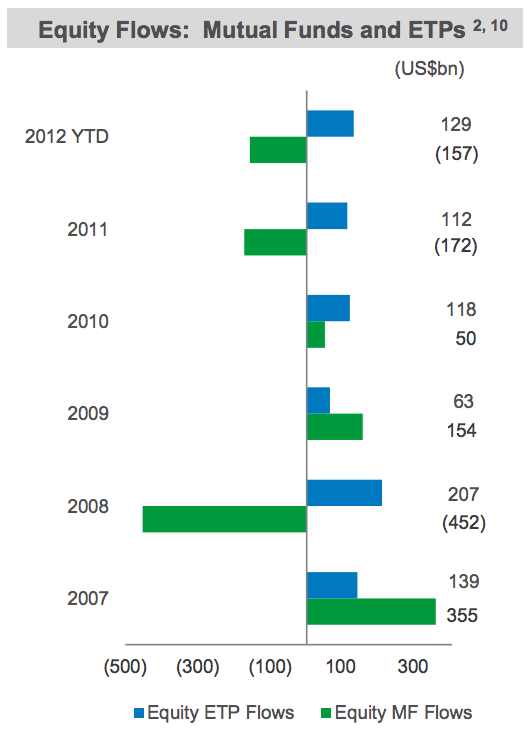 one-third of assets in new ETPs went to those in that region.
10. There was notable divergence of $287 billion between flows into equity ETPs and out of equity mutual funds. While retail investors pulled $157 billion out of equity mutual funds, they invested $129 billion into equity ETFs. “Equity returns were positive this year and ETPs still out-gathered mutual funds in equities,” BlackRock said. This was perhaps the most surprising development to me: Why would, in a positive equity market, retail investors pull so much out of equity mutual funds? Why were ETFs immune to this behavior? I believe this is further proof of the shift toward low-cost index investing.
11. The cyclical timing of 2012 flows was quite different than the typical pattern with a stronger January than prior years. According to BlackRock, January 2012 was the best January ever for the industry, with $33.5 billion of inflows and representing 14 percent of the 2012 total. BlackRock does not expect January 2013, however, to be as great; headwinds are expected as investors unwind year-end tactical positions.
12. Last but not least but perhaps less surprising: Breadth in the market continues to expand. There are now 480 ETPs in trading that have surpassed $500 million in assets, compared to 340 offered in 2009.